OPEN-SOURCE SCRIPT
Inverted USDT Dominance

Inverted USDT Dominance Indicator
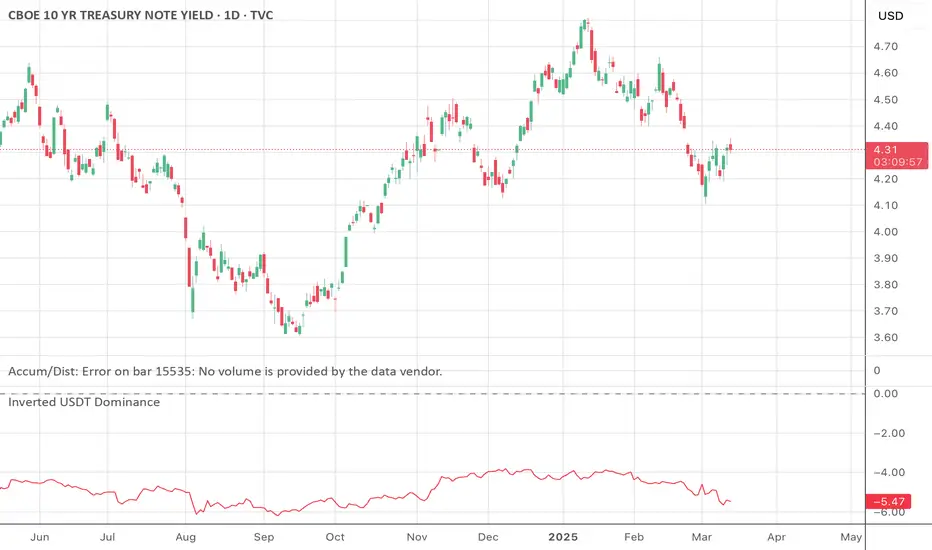
This simple yet powerful indicator plots the inverted USDT Dominance (USDT.D), making it visually intuitive to analyze market sentiment shifts. Typically, USDT dominance rises when investors seek stability, indicating a "risk-off" market environment. Conversely, it falls when investors pursue riskier assets like cryptocurrencies, signaling a "risk-on" environment.
Why invert the USDT Dominance chart?
By flipping USDT Dominance around the zero line, this indicator allows traders and investors to more clearly visualize its correlation and divergence with traditional market indicators like the 10-year Treasury yield (TNX), Bitcoin, or equity indices. A rising line on this inverted indicator intuitively indicates increasing market risk appetite, whereas a falling line highlights growing risk aversion.
Use cases:
Quickly visualize market sentiment (risk-on vs. risk-off).
Identify divergences and correlations between crypto markets and traditional financial instruments.
Enhance portfolio allocation decisions by clearly seeing sentiment changes.
סקריפט קוד פתוח
ברוח האמיתית של TradingView, יוצר הסקריפט הזה הפך אותו לקוד פתוח, כך שסוחרים יוכלו לעיין בו ולאמת את פעולתו. כל הכבוד למחבר! אמנם ניתן להשתמש בו בחינם, אך זכור כי פרסום חוזר של הקוד כפוף ל־כללי הבית שלנו.
כתב ויתור
המידע והפרסומים אינם מיועדים להיות, ואינם מהווים, ייעוץ או המלצה פיננסית, השקעתית, מסחרית או מכל סוג אחר המסופקת או מאושרת על ידי TradingView. קרא עוד ב־תנאי השימוש.