PROTECTED SOURCE SCRIPT
מעודכן TrendBand Guide
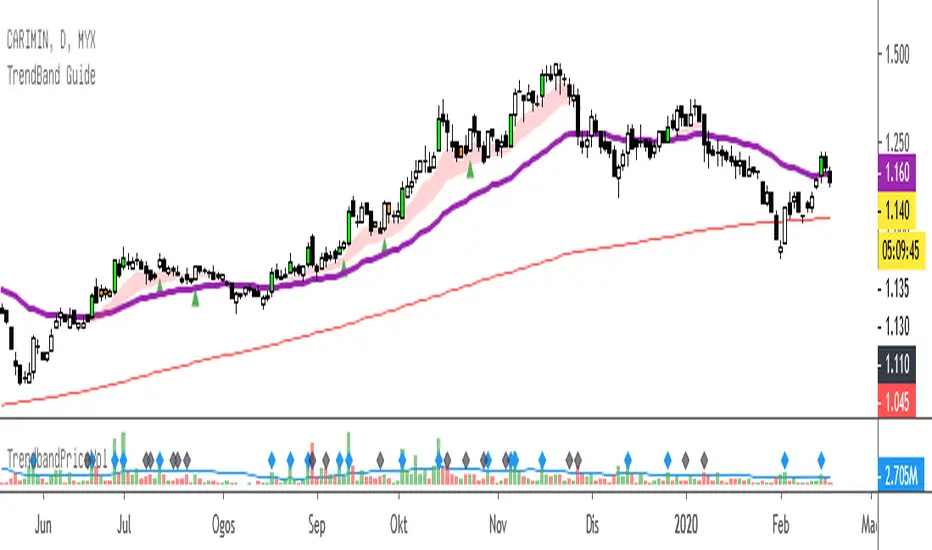
TrendBand Guide - simple way to analyse current chart trend.
Basic of usage:
1. TrendBand Color
Red : Chart in bullish condition
Green : Chart in bearish condition
Purple Line : Current trend direction
Red Line : Long term trend direction
2. Candle Color
Green Lime : Breakout 20 days high with more than average volume.
Red : Oversold condition base on RSI (14) days - below 35.
Note :
All color can be change from format menu.
When TrendBand in RED, find any breakout or pullback setup.
When TrendBand in Green, it show weakness in trend..find any potential rebound setup.
הערות שחרור
Update : Change RSI from 30 to 35 for oversold (red candle)הערות שחרור
Additional green arrow - potential signal for pullback breakoutהערות שחרור
UPDATE- change from green arrow up to green triangle up
- change green candle breakout calculation
Add
- red triangle down, when price make new high but close lower
- black triangle up, when price make new low but close higher
הערות שחרור
UPDATE : Change algorithm for RED TRIANGLEADD : Alert Condition for Green Candle, Green Triangle and Black Triangle
הערות שחרור
UPDATE : rename object titleהערות שחרור
Add OnINSIDE BAR
- Orange Candle
ATR Trailing Stop
- blue cross and horizontal red line
- only appear at green candle
הערות שחרור
Update : Add name Stop Loss (Stopp Loss and Stop Loss Line)הערות שחרור
Add On Input- Breakout Candle
- Trailing Stop
- Break Weekly Low
- Oversold Mode
Update
- black triangle (less signal)
הערות שחרור
Latest update- option to chose MA or EMA for Long Term Line
- Change title "MA200" to "Long Term"
- Additional alert for "Oversold Entry"
הערות שחרור
1. Convert to pinescript version 42. Label
- New label with suggestion trading idea
- Spesific for trendband guide signal
3. Trailing Stop
- Improve calculation
4. Add On
- Green Bar Line (breakout line)
- Red Bar Line (bearish engulfing line)
- Red Alert
5. New Alert !
- Signal Trendband (all in one)
הערות שחרור
Objective- less noisy signal
Add
- new design for trading idea's label
- horizontal line for stop loss, breakout price and target price
- input by date for trading idea
- 52 week high/low
- new pullback signal (down bar)
- fix long term line to MA 200 only
Remove
- lowest low signal
- red candle for oversold signal
הערות שחרור
change minimum breakout candle to 5הערות שחרור
- change label size from small to normal- change % location from left to right in label
הערות שחרור
- Remove big label and change with breakout price- Remove entry input
- Re-arrange text for target price and stop loss
- Change calculation for target price
הערות שחרור
Update- breakoutbar now follow pricevolume
- add trading plan placeholder for dynamic alert message
- update alert
- update inside bar
- remove stop loss character
סקריפט מוגן
סקריפט זה פורסם כמקור סגור. עם זאת, תוכל להשתמש בו בחופשיות וללא כל מגבלות – למד עוד כאן
כתב ויתור
המידע והפרסומים אינם מיועדים להיות, ואינם מהווים, ייעוץ או המלצה פיננסית, השקעתית, מסחרית או מכל סוג אחר המסופקת או מאושרת על ידי TradingView. קרא עוד ב־תנאי השימוש.
סקריפט מוגן
סקריפט זה פורסם כמקור סגור. עם זאת, תוכל להשתמש בו בחופשיות וללא כל מגבלות – למד עוד כאן
כתב ויתור
המידע והפרסומים אינם מיועדים להיות, ואינם מהווים, ייעוץ או המלצה פיננסית, השקעתית, מסחרית או מכל סוג אחר המסופקת או מאושרת על ידי TradingView. קרא עוד ב־תנאי השימוש.