OPEN-SOURCE SCRIPT
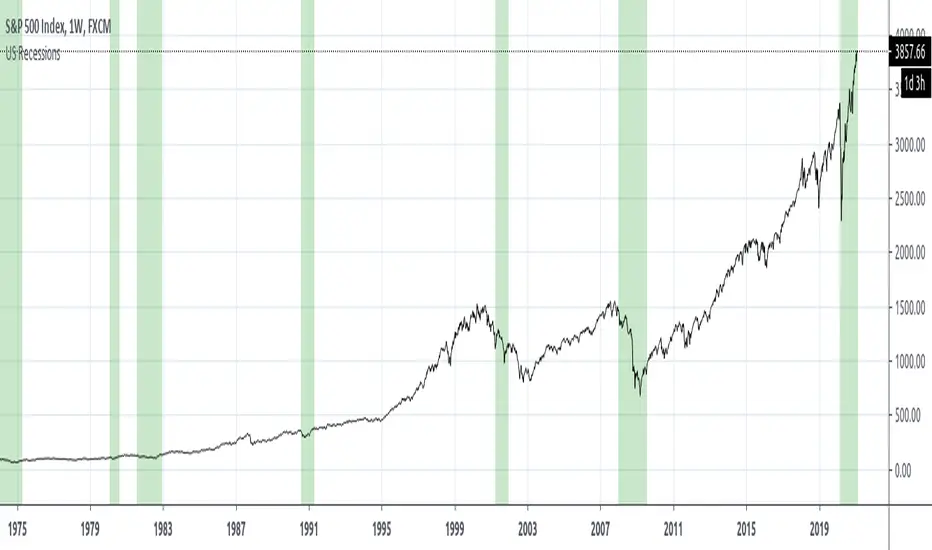
US Recessions

There are a couple of other Pine Scripts on TradingView that others have kindly contributed but they are presently out-dated because they shade recessions based on manual entries of time. Thanks to the availability of pulling data from QUANDL, we can pull official data from FRED on data like US Recessions.
The FRED series data is taken from is here- https://fred.stlouisfed.org/series/USRECD
"Our time series is composed of dummy variables that represent periods of expansion and recession. A value of 1 is a recessionary period, while a value of 0 is an expansionary period. For this time series, the recession begins on the 15th day of the month of the peak and ends on the 15th day of the month of the trough. This time series is a disaggregation of the monthly series."
This series tracks back to 1854, but good luck finding much of any data on TradingView that goes that far back :)
סקריפט קוד פתוח
ברוח האמיתית של TradingView, יוצר הסקריפט הזה הפך אותו לקוד פתוח, כך שסוחרים יוכלו לעיין בו ולאמת את פעולתו. כל הכבוד למחבר! אמנם ניתן להשתמש בו בחינם, אך זכור כי פרסום חוזר של הקוד כפוף ל־כללי הבית שלנו.
כתב ויתור
המידע והפרסומים אינם מיועדים להיות, ואינם מהווים, ייעוץ או המלצה פיננסית, השקעתית, מסחרית או מכל סוג אחר המסופקת או מאושרת על ידי TradingView. קרא עוד ב־תנאי השימוש.