PROTECTED SOURCE SCRIPT
Traders Dynamic Index

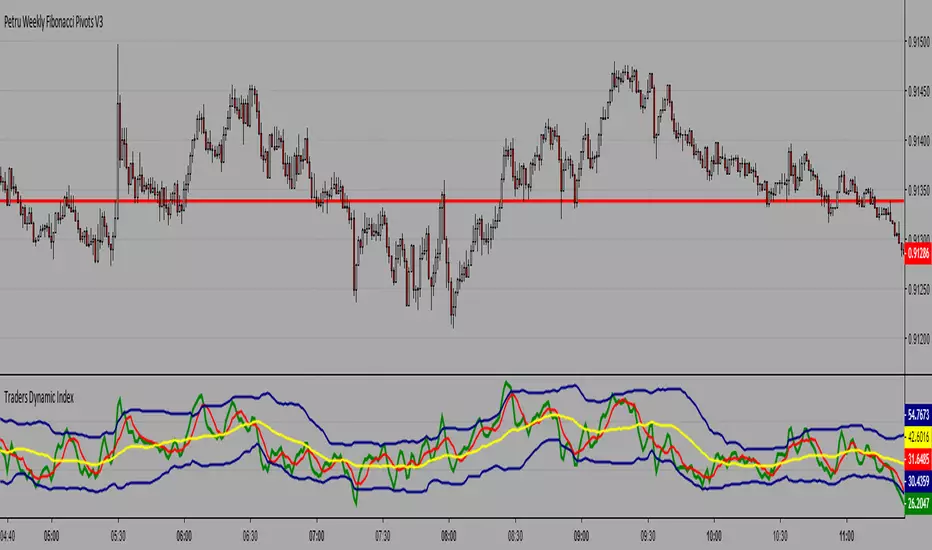
At a first glance, Traders Dynamic Index is not too easy to use, but you will get accustomed to it:
For scalping, enter long when the green line is above the red line and enter short when the red line is the above green line.
For short-term trading, enter long when the green is above both the red and the yellow lines; enter short when the red one is above both the green and the yellow ones.
For medium-term trading, go long under the same conditions as for the short-term trading but only when all lines are below 50; to go short — the same but above 50.
8
Mind the blue volatility band as it points to the long-term trend strength and volatility when wide. Steep green line changes also signal short-term market volatility.
סקריפט מוגן
סקריפט זה פורסם כמקור סגור. עם זאת, תוכל להשתמש בו בחופשיות וללא כל מגבלות – למד עוד כאן
כתב ויתור
המידע והפרסומים אינם מיועדים להיות, ואינם מהווים, ייעוץ או המלצה פיננסית, השקעתית, מסחרית או מכל סוג אחר המסופקת או מאושרת על ידי TradingView. קרא עוד ב־תנאי השימוש.
סקריפט מוגן
סקריפט זה פורסם כמקור סגור. עם זאת, תוכל להשתמש בו בחופשיות וללא כל מגבלות – למד עוד כאן
כתב ויתור
המידע והפרסומים אינם מיועדים להיות, ואינם מהווים, ייעוץ או המלצה פיננסית, השקעתית, מסחרית או מכל סוג אחר המסופקת או מאושרת על ידי TradingView. קרא עוד ב־תנאי השימוש.