OPEN-SOURCE SCRIPT
Resistances v2[UO] - Uncluttered Display
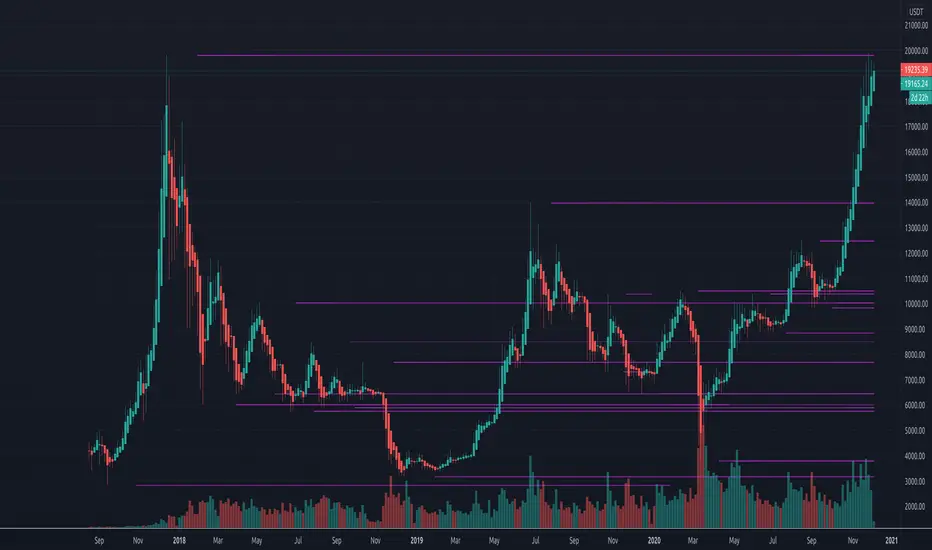
This script shows support-and-resistance levels that span months and weeks.
It also shows the levels in the last 100 bars in higher detail. Details detection is only applied to last 100 bars so that your chart is not cluttered with infinite horizontal lines. 100 can be changed in the settings.
For example, here, you see the levels in small time frames at a different detail level:
This script uses the arrays introduced in pine script v4
סקריפט קוד פתוח
ברוח האמיתית של TradingView, יוצר הסקריפט הזה הפך אותו לקוד פתוח, כך שסוחרים יוכלו לעיין בו ולאמת את פעולתו. כל הכבוד למחבר! אמנם ניתן להשתמש בו בחינם, אך זכור כי פרסום חוזר של הקוד כפוף ל־כללי הבית שלנו.
כתב ויתור
המידע והפרסומים אינם מיועדים להיות, ואינם מהווים, ייעוץ או המלצה פיננסית, השקעתית, מסחרית או מכל סוג אחר המסופקת או מאושרת על ידי TradingView. קרא עוד ב־תנאי השימוש.