OPEN-SOURCE SCRIPT
MTF Support & Resistance (Optimized)

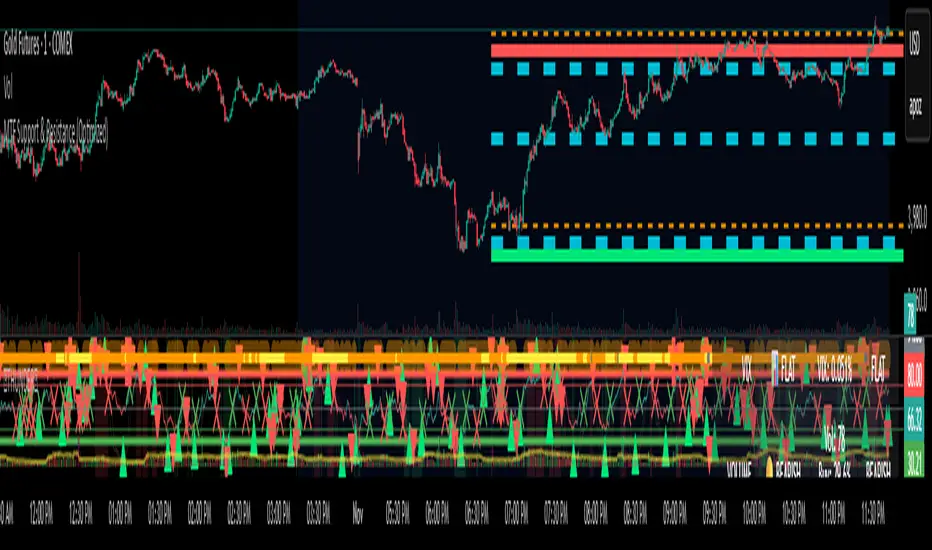
🧠 Smart Multi-Timeframe Support & Resistance (4H / 1H)
This advanced indicator automatically detects, clusters, and visualizes high-probability support and resistance levels across multiple timeframes — giving traders a clean and intelligent market map that adapts to price action in real time.
🔍 How It Works
The script scans historical 4-hour and 1-hour charts to identify swing highs and lows using pivot logic.
It then applies ATR-based clustering to merge nearby levels, filters weak or irrelevant zones, and highlights the most significant price reaction areas based on the number of touches and proximity to the current price.
Each level’s thickness and transparency are dynamically adjusted by strength:
Thicker lines = more confirmations (stronger level)
Fainter lines = weaker, less-tested level
⚙️ Main Features
✅ Multi-Timeframe Analysis (4H + 1H)
✅ Automatic pivot detection and level clustering
✅ Smart filtering based on ATR, proximity, and touch count
✅ Dynamic line width and opacity that scale with level strength
✅ Minimal clutter — only the most relevant nearby levels are displayed
✅ Color-coded visualization for quick interpretation
🔴 Red = 4H Resistance
🟢 Lime = 4H Support
🟠 Orange = 1H Resistance
🟦 Aqua = 1H Support
🎯 Ideal For
Scalpers, swing traders, and intraday analysts who want:
A clear visual map of major reaction zones
Automatic detection of high-confluence levels
A smart, adaptive system that works across assets and timeframes
📈 Usage Tips
Combine with volume, order-flow, or market-structure tools for confluence.
Use higher-strength levels (thicker lines) as bias zones for entries and exits.
Enable or disable 4H/1H visibility to match your trading style.
Built with precision and performance in mind — this Smart S&R system transforms raw swing data into a readable, multi-layered price map for confident trading decisions.
סקריפט קוד פתוח
ברוח האמיתית של TradingView, יוצר הסקריפט הזה הפך אותו לקוד פתוח, כך שסוחרים יוכלו לעיין בו ולאמת את פעולתו. כל הכבוד למחבר! אמנם ניתן להשתמש בו בחינם, אך זכור כי פרסום חוזר של הקוד כפוף ל־כללי הבית שלנו.
כתב ויתור
המידע והפרסומים אינם מיועדים להיות, ואינם מהווים, ייעוץ או המלצה פיננסית, השקעתית, מסחרית או מכל סוג אחר המסופקת או מאושרת על ידי TradingView. קרא עוד ב־תנאי השימוש.