OPEN-SOURCE SCRIPT
SPPO — Simple Percentage Price Oscillator
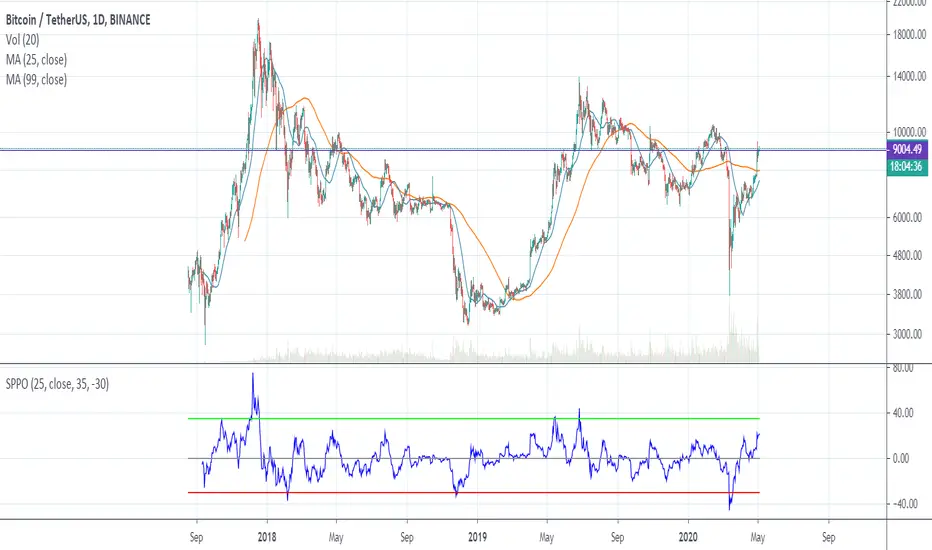
SPPO is Simple Percentage Price Oscillator .
SPPO is calculated as the ratio of the current price to the moving average.
This indicator is used in the trading strategy to determine overbought and oversold markets. Chart period D1.
I use this oscillator on the BTCUSD and ETHUSD pairs. It can also be used on other top crypto symbols.
If SPPO on the BTCUSDT chart > 35%, this means that in the Bitcoin market pamp . So it’s time to close long positions.
If SPPO on the bitcoin chart is <-30%, then bitcoin is oversold and you need to think about starting to buy it.
Recommended timeframe: 1d
Input parameters:
MA Length — number of bars for moving average. Default = 25.
Source — type of price used to calculate the MA. Default = close.
High Level — upper horizontal constant on the SPPO chart. Default = 35.
Low Level — lower horizontal constant on the SPPO chart. Default = -35.
Simple MA(Oscillator) — type of MA indicator used. If false = Exponential Moving Average , if true = Simple Moving Average . Default = true.
סקריפט קוד פתוח
ברוח האמיתית של TradingView, יוצר הסקריפט הזה הפך אותו לקוד פתוח, כך שסוחרים יוכלו לעיין בו ולאמת את פעולתו. כל הכבוד למחבר! אמנם ניתן להשתמש בו בחינם, אך זכור כי פרסום חוזר של הקוד כפוף ל־כללי הבית שלנו.
כתב ויתור
המידע והפרסומים אינם מיועדים להיות, ואינם מהווים, ייעוץ או המלצה פיננסית, השקעתית, מסחרית או מכל סוג אחר המסופקת או מאושרת על ידי TradingView. קרא עוד ב־תנאי השימוש.