OPEN-SOURCE SCRIPT
Candle-Based Negative Space (Improved)
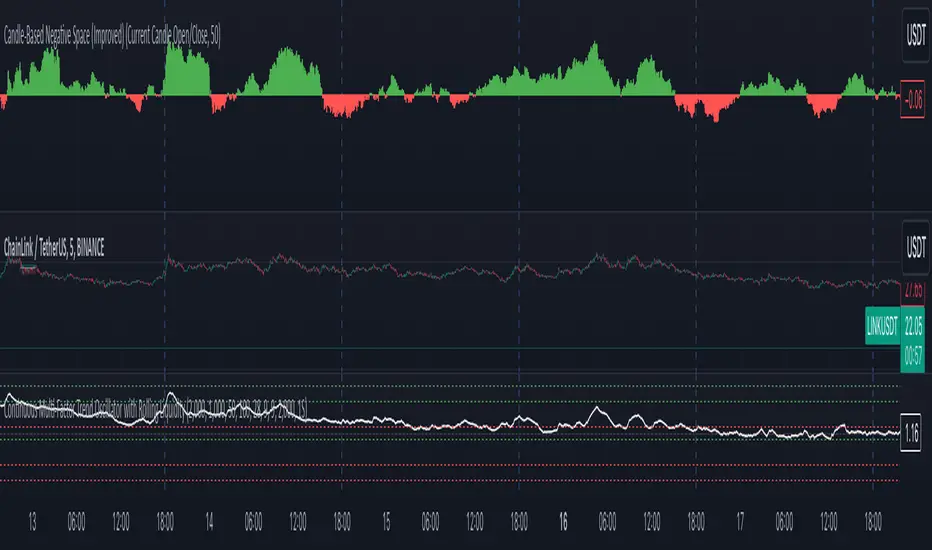
This script visualizes the concept of negative space (when a candle closes below a defined baseline) and positive space (when a candle closes above the baseline) on a price chart. It uses user-defined inputs to configure the baseline and optionally includes a moving average for additional trend analysis. Below is a detailed explanation of the script and suggestions for improving its plotting.
Explanation of the Script
Purpose
The script helps traders visualize the relationship between price movements and a dynamically chosen baseline. The baseline can be based on:
The high/low of the previous candle.
The open/close of the current candle.
The "negative space" is calculated when the closing price is below the baseline, and the "positive space" is calculated when the closing price is above the baseline. The sum of these spaces over a period is plotted as a histogram to provide insights into market strength.
סקריפט קוד פתוח
ברוח האמיתית של TradingView, יוצר הסקריפט הזה הפך אותו לקוד פתוח, כך שסוחרים יוכלו לעיין בו ולאמת את פעולתו. כל הכבוד למחבר! אמנם ניתן להשתמש בו בחינם, אך זכור כי פרסום חוזר של הקוד כפוף ל־כללי הבית שלנו.
כתב ויתור
המידע והפרסומים אינם מיועדים להיות, ואינם מהווים, ייעוץ או המלצה פיננסית, השקעתית, מסחרית או מכל סוג אחר המסופקת או מאושרת על ידי TradingView. קרא עוד ב־תנאי השימוש.