OPEN-SOURCE SCRIPT
Volatility Heat-Map, momentum ribbon and divergence detector
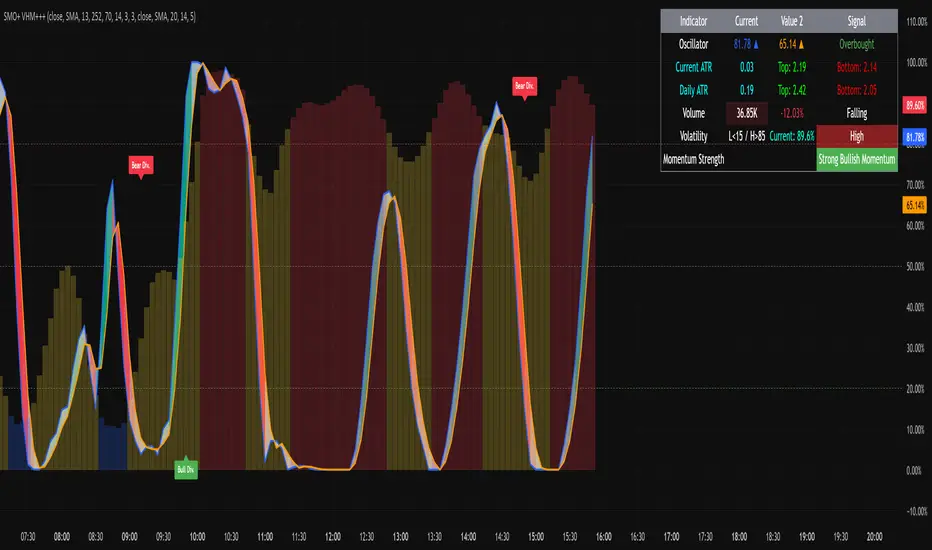
This is a comprehensive volatility + momentum + volume + ATR dashboard with table visualization, momentum ribbon, and divergence detection. It’s optimized for visual clarity with dynamic coloring and is suitable for both trend-following and mean-reversion traders.
Table shows:
Oscillator values with arrows and K/D status.
Current & Daily ATR with tops/bottoms.
Volume & % change, rising/falling indicator.
Volatility regime (Low/Normal/High) with color coding.
Momentum strength (strong/weak bullish/bearish).
Oscillator
stoch = hh != ll ? 100 * (src - ll) / (hh - ll) : 0
k = smooth(stoch, kSmoothing)
d = smooth(k, dSmoothing)
Standard stochastic normalization.
Smoothing based on selected type (SMA/EMA/WMA).
diff between K and D is normalized for the momentum ribbon color:
Greenish for bullish, red for bearish, silver for neutral.
Overbought / Oversold lines: 80/20, midline at 50.
4. BBWP Calculation
bbwp = f_bbwp(i_priceSrc, i_bbwpLen, i_bbwpLkbk, i_basisType)
bbwpSMA5 = f_maType(bbwp, 5, "SMA")
Heatmap Thresholds:
Low < 15%
High > 85%
Otherwise Normal.
Colors dynamically assigned for histogram and table background.
Plotted as columns if table
Bullish and Bearish divergence labels plotted, both regular and hidden.
סקריפט קוד פתוח
ברוח TradingView אמיתית, היוצר של הסקריפט הזה הפך אותו לקוד פתוח, כך שסוחרים יכולים לבדוק ולאמת את הפונקציונליות שלו. כל הכבוד למחבר! למרות שאתה יכול להשתמש בו בחינם, זכור שפרסום מחדש של הקוד כפוף לכללי הבית שלנו.
Want to join a safe community full of like-minded individuals that work together, not against each other? Join Xtrader! Link for more amazing indicators and support.
discord.gg/NHjztdYv6U
discord.gg/NHjztdYv6U
כתב ויתור
המידע והפרסומים אינם אמורים להיות, ואינם מהווים, עצות פיננסיות, השקעות, מסחר או סוגים אחרים של עצות או המלצות שסופקו או מאושרים על ידי TradingView. קרא עוד בתנאים וההגבלות.