Uptrick: Majors Directional Bias
Uptrick: Majors Directional Bias is a trend-following indicator designed for higher timeframe markets, with a particular focus on the daily chart. It keeps a persistent bullish or bearish stance, highlights confirmed trend flips with one-time markers, and plots a slim, adaptive flow trail that often acts as dynamic support in bullish conditions and resistance in bearish conditions. It is purpose-built for BTC, ETH, and SOL, with safeguards to warn users if applied elsewhere.
Introduction
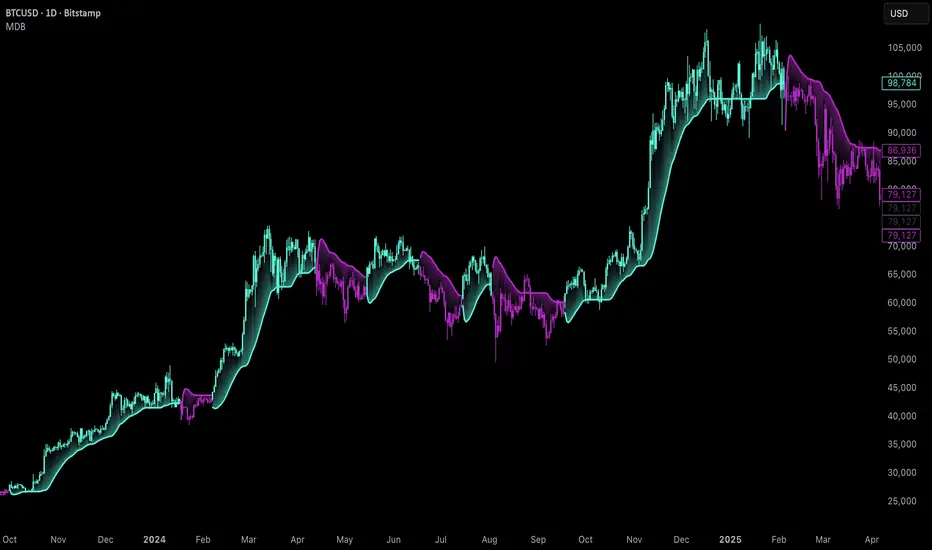
This indicator was created to simplify trend tracking on higher timeframes. Rather than layering multiple moving averages, oscillators, or external signals, it keeps everything on the price chart itself. Candles are colored by the active stance, a single marker shows the bar where a trend flip is confirmed, and the flow trail follows price closely while adjusting to volatility. For traders working with the daily chart, the trail becomes a practical tool: in an uptrend, it often serves as a natural stop placement zone or structural support, while in a downtrend it behaves like dynamic resistance. The combination of persistence, confirmation, and structure gives traders a clean map of market direction without noise or clutter.
Purpose
The tool is designed to help traders follow medium to long-term market trends rather than react to short intraday moves. Its focus is clarity and continuity — it latches onto a stance and only changes when a new confirmed flip occurs. This makes it suitable for swing traders and position traders who want to stay aligned with the prevailing trend on the daily chart.
Practical uses include identifying trend shifts, entering trades in the direction of the new stance, managing positions by trailing stops along the flow trail, and monitoring pullbacks for whether they respect or break the trail. In this way, the indicator supports both entry timing and ongoing trade management on higher timeframe markets.
Originality and uniqueness
The originality of this script lies in its blend of complexity and simplicity. Internally, it uses multiple filters and layered components to reduce market noise, smooth out erratic fluctuations, and avoid false flips that are common on higher timeframes. Externally, the presentation is deliberately simple: candles are colored by trend, a single marker identifies each confirmed flip, and a slim trail with soft fills shows where the trend structure sits. Many tools either overload traders with information or flicker constantly in uncertain conditions. This script strikes a balance — complex logic works in the background, but what the trader sees is minimal and actionable. Its ability to filter out noise, persist with confidence, and present direction in the simplest terms makes it unique among trend-following overlays.
Why these components were merged
Each component has a clear role in supporting higher timeframe trading. Persistent bias coloring ensures the dominant trend is always visible, making it easy to stay aligned with the market. Flip markers give clarity by identifying the exact bar where the stance shifts, allowing traders to backtest or audit trends quickly. The flow trail provides a structural guide that adapts to volatility: in bull phases it runs under price, often acting as support, while in bear phases it runs above price, often behaving as resistance. Together, these features provide three layers of information in one view — direction, confirmation, and structure — giving traders a reliable framework for swing and position trading on the daily chart.
Step-by-Step
- The script determines the dominant trend and locks that stance until an opposite confirmation occurs.
- On confirmation of a new trend, a single marker prints on the bar of the flip.
- A slim, adaptive trail plots under price in bull phases and above price in bear phases, with a soft fill to reinforce the state.
- Price candles are colored by the active stance so the overall direction is always clear.
- If the indicator is loaded on assets outside BTC, ETH, or SOL, a warning panel appears to set expectations.
Features
Persistent trend stance
Candles are always bull or bear, with no neutral state. This reduces ambiguity and keeps the trend visible at all times.
One-time flip markers
Markers plot once at the confirmed flip bar, preventing repetitive clutter and making historical review straightforward.
Adaptive flow trail with soft fill
The trail tracks price while adjusting to volatility. In bull trends it acts like dynamic support, in bear trends like dynamic resistance. Traders can use it as a practical stop-loss reference, trailing their risk along the line as the trend progresses.
Noise filtering logic
Internally, the indicator applies multiple filters and components to dampen false signals and avoid unnecessary flips. This is particularly important on higher timeframes, where swings are larger and stability is critical.
Asset-aware design
The indicator is tuned for BTC, ETH, and SOL, with an internal mode that adapts its responsiveness to each. A warning panel appears when used outside these majors.
Overlay-only clarity
Everything is drawn directly on the main chart. The trail gaps at regime changes, fills are soft and non-obstructive, and the overall design emphasizes readability on higher timeframe candles.
Conclusion
The MDB is a higher timeframe trend-following overlay built for BTC, ETH, and SOL, with daily charts as its ideal setting. It combines persistent bias coloring, one-time flip markers, and an adaptive flow trail to give traders direction, confirmation, and structure in the simplest possible form. Internally, it uses complex filtering to reduce noise and maintain reliable signals, but externally it stays minimal and clean. For swing and position traders who want to follow the daily trend with clarity and discipline, this indicator provides a focused solution.
Disclaimer
This indicator is provided for educational and informational purposes only and does not constitute financial advice. Trading involves risk, including the risk of loss. Past performance does not guarantee future results. Always conduct your own analysis and use appropriate risk management.
סקריפט להזמנה בלבד
רק משתמשים שאושרו על ידי המחבר יכולים לגשת לסקריפט הזה. יהיה עליך לשלוח בקשת גישה ולקבל אישור לשימוש. בדרך כלל, הגישה ניתנת לאחר תשלום. למידע נוסף, עקוב אחר ההוראות של היוצר בהמשך או צור קשר עם Uptrick ישירות.
TradingView לא ממליצה לשלם עבור סקריפט או להשתמש בו אלא אם כן אתה סומך לחלוטין על המחבר שלו ומבין כיצד הוא פועל. ייתכן שתוכל גם למצוא חלופות חינמיות וקוד פתוח ב-סקריפטים הקהילתיים שלנו.
הוראות המחבר
💎 Website: uptrick.io
Nothing is financial advice. Always do your own research.
כתב ויתור
סקריפט להזמנה בלבד
רק משתמשים שאושרו על ידי המחבר יכולים לגשת לסקריפט הזה. יהיה עליך לשלוח בקשת גישה ולקבל אישור לשימוש. בדרך כלל, הגישה ניתנת לאחר תשלום. למידע נוסף, עקוב אחר ההוראות של היוצר בהמשך או צור קשר עם Uptrick ישירות.
TradingView לא ממליצה לשלם עבור סקריפט או להשתמש בו אלא אם כן אתה סומך לחלוטין על המחבר שלו ומבין כיצד הוא פועל. ייתכן שתוכל גם למצוא חלופות חינמיות וקוד פתוח ב-סקריפטים הקהילתיים שלנו.
הוראות המחבר
💎 Website: uptrick.io
Nothing is financial advice. Always do your own research.