OPEN-SOURCE SCRIPT
DAPD - Strategy Backtest
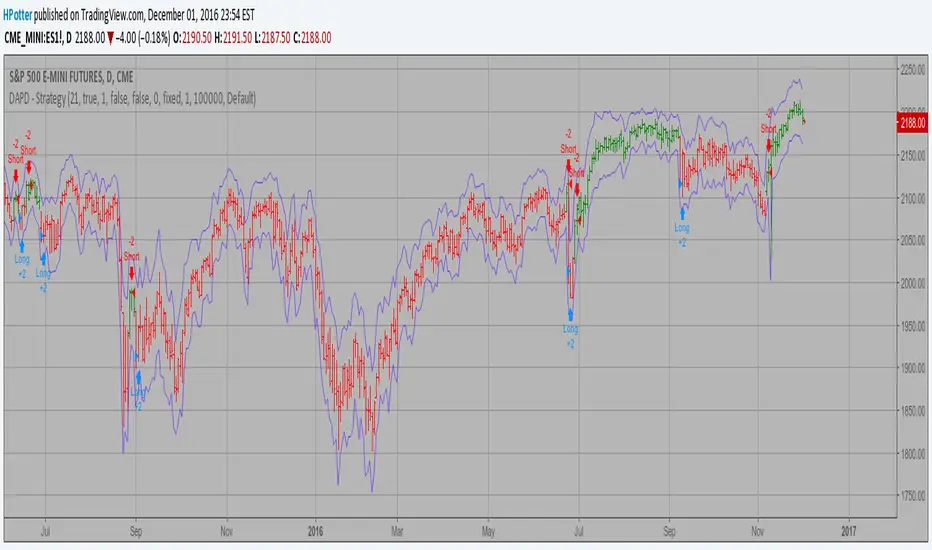
This indicator is similar to Bollinger Bands. It based on DAPD - Daily
Average Price Delta. DAPD is based upon a summation for each of the
highs (hod) for the 21 days prior to today minus the summation for
each of the lows (lod) for the last 21 days prior to today. The result
of this calculation would then be divided by 21.
It will be buy when high above previos DAPD high and sell if low below previos DAPD low
You can change long to short in the Input Settings
Please, use it only for learning or paper trading. Do not for real trading.
סקריפט קוד פתוח
ברוח האמיתית של TradingView, יוצר הסקריפט הזה הפך אותו לקוד פתוח, כך שסוחרים יוכלו לעיין בו ולאמת את פעולתו. כל הכבוד למחבר! אמנם ניתן להשתמש בו בחינם, אך זכור כי פרסום חוזר של הקוד כפוף ל־כללי הבית שלנו.
כתב ויתור
המידע והפרסומים אינם מיועדים להיות, ואינם מהווים, ייעוץ או המלצה פיננסית, השקעתית, מסחרית או מכל סוג אחר המסופקת או מאושרת על ידי TradingView. קרא עוד ב־תנאי השימוש.