OPEN-SOURCE SCRIPT
Murrey Math Extremes Comparator
HOW IT WORKS
Creates two murrey math oscillators (hidden) one with 256 length another with 32 length and compare each other.
WHAT GIVE ME THIS SCRIPT
The script can give you very valuable information:
- Main Trend
- Pullbacks detections
- Extreme overbought oversold prices alerts
- Divergences
- Any timeframe usage
REFERENCES OF USAGE
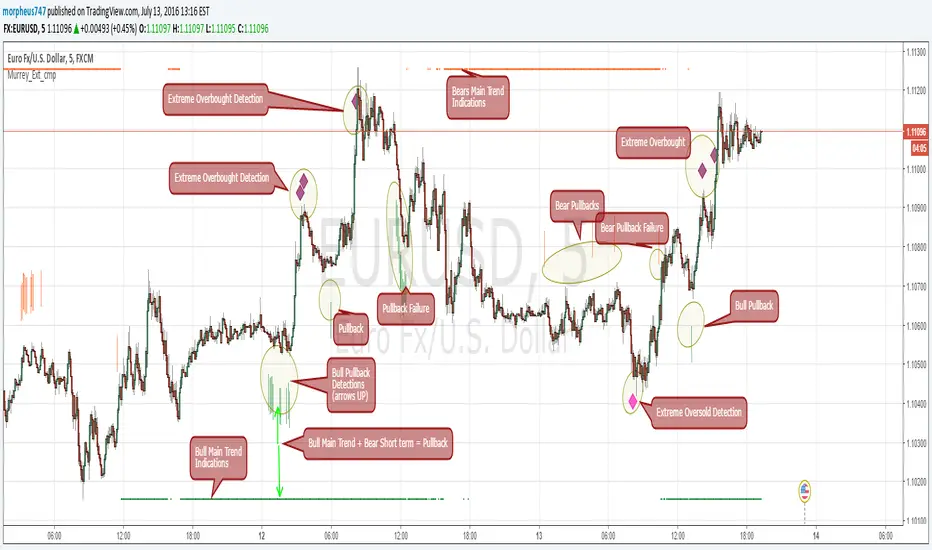
Main Trend Indications
****The main trend is indicated with green(bull) or red(bears) small "triangles" on the bottom(bull) or the top(bears) of the chart.
*****To detect the Bull/Bear major trend the script use 256 murrey, if > 0 (green) we are uptrend in other cases we are downtrend
Pullback detection
****The pullbacks are indicated with Green(bull) or red(bears) medium "Arrows"
*****To detect pullbacks the system compare the long term murrey with the short term murrey, if long term is Green(green triangles)
*****so we are in a main bull trend, if the short term murrey make an extreme low then the pullback is indicated
*****The same for the short pullback, if long term murrey is RED and we have an extreme green short term murrey we shot a red arrow
Extreme Overbught/Oversold
****The extreme OO is indicated with fancy diamonds
*****To detect the Extremes price movements we combine the two murrey, if Long Term Murrey is overbought and short term murrey too
*****Then the diamond show on the screen obove or below based on the extreme if overbought or oversold
Strategy Resume:
Triangles indicate Major Trend Up/Down
Arrows Indicate Continuation pullbacks
Diamonds Indicate Extreme Prices
GUIDE HOW TO IMAGES

How it's works Behind Scene

Creates two murrey math oscillators (hidden) one with 256 length another with 32 length and compare each other.
WHAT GIVE ME THIS SCRIPT
The script can give you very valuable information:
- Main Trend
- Pullbacks detections
- Extreme overbought oversold prices alerts
- Divergences
- Any timeframe usage
REFERENCES OF USAGE
Main Trend Indications
****The main trend is indicated with green(bull) or red(bears) small "triangles" on the bottom(bull) or the top(bears) of the chart.
*****To detect the Bull/Bear major trend the script use 256 murrey, if > 0 (green) we are uptrend in other cases we are downtrend
Pullback detection
****The pullbacks are indicated with Green(bull) or red(bears) medium "Arrows"
*****To detect pullbacks the system compare the long term murrey with the short term murrey, if long term is Green(green triangles)
*****so we are in a main bull trend, if the short term murrey make an extreme low then the pullback is indicated
*****The same for the short pullback, if long term murrey is RED and we have an extreme green short term murrey we shot a red arrow
Extreme Overbught/Oversold
****The extreme OO is indicated with fancy diamonds
*****To detect the Extremes price movements we combine the two murrey, if Long Term Murrey is overbought and short term murrey too
*****Then the diamond show on the screen obove or below based on the extreme if overbought or oversold
Strategy Resume:
Triangles indicate Major Trend Up/Down
Arrows Indicate Continuation pullbacks
Diamonds Indicate Extreme Prices
GUIDE HOW TO IMAGES
How it's works Behind Scene
סקריפט קוד פתוח
ברוח האמיתית של TradingView, יוצר הסקריפט הזה הפך אותו לקוד פתוח, כך שסוחרים יוכלו לעיין בו ולאמת את פעולתו. כל הכבוד למחבר! אמנם ניתן להשתמש בו בחינם, אך זכור כי פרסום חוזר של הקוד כפוף ל־כללי הבית שלנו.
כתב ויתור
המידע והפרסומים אינם מיועדים להיות, ואינם מהווים, ייעוץ או המלצה פיננסית, השקעתית, מסחרית או מכל סוג אחר המסופקת או מאושרת על ידי TradingView. קרא עוד ב־תנאי השימוש.