OPEN-SOURCE SCRIPT
מעודכן HTF FVG D/W/M 25%/50%/75% [MK]
Do you use HTF FVG (fair value gaps) in your trading strategy? Do you monitor price on the 25%/50%/75% levels within the FVG on a lower timeframe?
This script will allow the user to display either Daily, Weekly or Monthly FVGs on a lower timeframe chart. The script will then also show the 25%/50%/75% levels within the HTF FVG so traders can see how price reacts in the FVG.
For example, a Weekly FVG may be chosen by the trader as a possible reversal point, or somewhere to add to an existing position. The trader might want to see the FVG almost fully filled, then watch price climb up/down out of the Weekly FVG
before taking the trade.
Previously traders would draw the FVG to the chart, then use maybe the tradingview fib tool to display the 25%/50%/75% levels. The problem with this is that its easy to accidently move the fib while dragging the chart around.
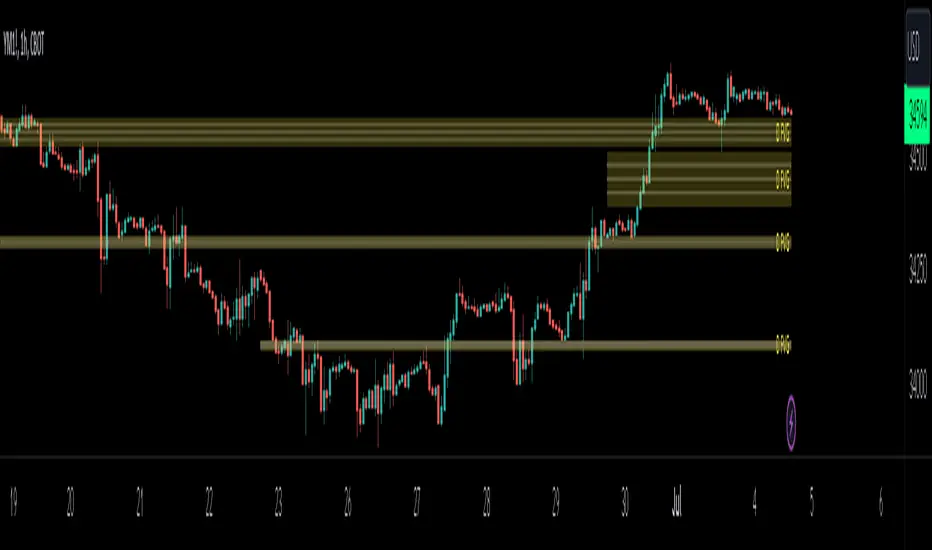
Chart below shows example of price almost filling a D FVG, then using the 25%/50%/75% levels as it climbs out of the FVG and reverses to the upside.

This script will allow the user to display either Daily, Weekly or Monthly FVGs on a lower timeframe chart. The script will then also show the 25%/50%/75% levels within the HTF FVG so traders can see how price reacts in the FVG.
For example, a Weekly FVG may be chosen by the trader as a possible reversal point, or somewhere to add to an existing position. The trader might want to see the FVG almost fully filled, then watch price climb up/down out of the Weekly FVG
before taking the trade.
Previously traders would draw the FVG to the chart, then use maybe the tradingview fib tool to display the 25%/50%/75% levels. The problem with this is that its easy to accidently move the fib while dragging the chart around.
Chart below shows example of price almost filling a D FVG, then using the 25%/50%/75% levels as it climbs out of the FVG and reverses to the upside.
הערות שחרור
added option to show FVG for any timeframeסקריפט קוד פתוח
ברוח האמיתית של TradingView, יוצר הסקריפט הזה הפך אותו לקוד פתוח, כך שסוחרים יוכלו לעיין בו ולאמת את פעולתו. כל הכבוד למחבר! אמנם ניתן להשתמש בו בחינם, אך זכור כי פרסום חוזר של הקוד כפוף ל־כללי הבית שלנו.
כתב ויתור
המידע והפרסומים אינם מיועדים להיות, ואינם מהווים, ייעוץ או המלצה פיננסית, השקעתית, מסחרית או מכל סוג אחר המסופקת או מאושרת על ידי TradingView. קרא עוד ב־תנאי השימוש.
סקריפט קוד פתוח
ברוח האמיתית של TradingView, יוצר הסקריפט הזה הפך אותו לקוד פתוח, כך שסוחרים יוכלו לעיין בו ולאמת את פעולתו. כל הכבוד למחבר! אמנם ניתן להשתמש בו בחינם, אך זכור כי פרסום חוזר של הקוד כפוף ל־כללי הבית שלנו.
כתב ויתור
המידע והפרסומים אינם מיועדים להיות, ואינם מהווים, ייעוץ או המלצה פיננסית, השקעתית, מסחרית או מכל סוג אחר המסופקת או מאושרת על ידי TradingView. קרא עוד ב־תנאי השימוש.