OPEN-SOURCE SCRIPT
מעודכן [blackcat] L1 Bullish Trend Indicator
#### Introduction
The "[blackcat] L1 Bullish Trend Indicator" is a unique tool designed for TradingView, tailored to identify and analyze bullish trends in the market. This guide provides an overview of its definition, history, calculation method, operations, and practical trading applications, tailored for both beginners and experienced traders.
#### Definition
- **Role in Technical Analysis**: Primarily identifies bullish trends by analyzing a combination of price and volume data.
- **Type of Indicator**: Classified as a trend indicator, it operates on multiple time frames, offering a comprehensive view of market momentum.
#### Calculation Method
- **Core Calculation**: Combines price action (hlc3 formula) and volume, calculating a series of Simple Moving Averages (SMAs) on this modified factor.
- **Timeframes**: Incorporates short, mid, and long-term analysis through specific length parameters like `len_shortterm1`, `len_midterm`, and `len_longterm`.
- **Output Interpretation**: Proportions calculated from SMAs indicate the relative strength of trends across different timeframes.
#### Basic Operations
- **Comparison with Similar Indicators**: Similar to SMAs and MACD but provides a more detailed multi-timeframe trend analysis.
- **Unique Features**: The multi-timeframe approach and price-volume factor analysis distinguish it from other trend indicators.
- **Practical Example**: A dominant long-term trend (blue candle) might suggest a more stable bullish trend compared to a short-term spike.
#### Style Settings
- **Visual Representation**: Utilizes `plotcandle` functions with specific colors for different trend conditions, enhancing the visual clarity.
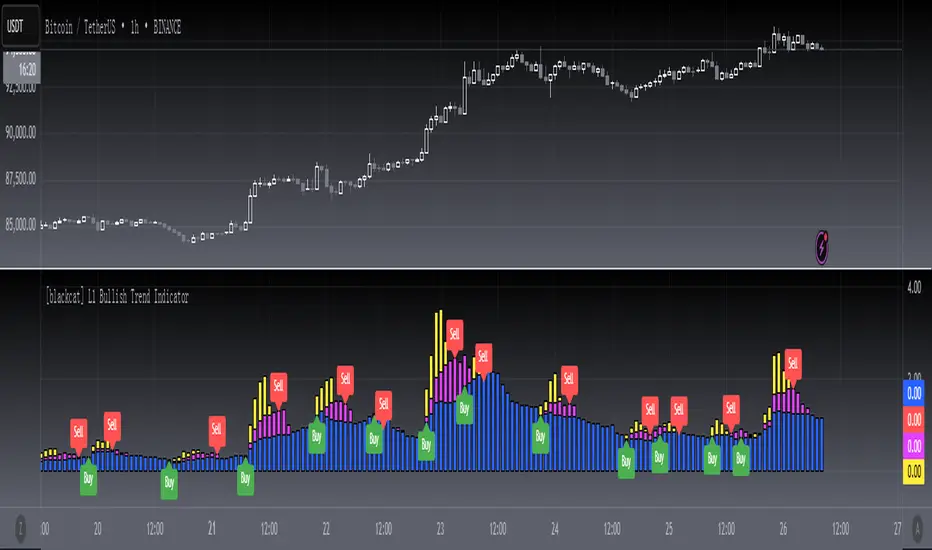
- **Color Coding**: Yellow for short-term trends, fuchsia for skyrocket trends, red for mid-term, and blue for long-term trends.
#### Trading Applications
- **Identifying Trends**: Effective in signaling the start and strength of bullish trends in various markets.
- **Combination with Other Tools**: Can be used alongside tools like RSI or MACD for reinforced trading decisions.
#### Conclusion
The "[blackcat] L1 Bullish Trend Indicator" is a powerful tool for traders looking to understand and capitalize on bullish market trends. Its unique combination of price and volume analysis, along with multi-timeframe integration, makes it a valuable addition to any trader's toolkit. Whether you're a beginner or a seasoned trader, this indicator offers insights that can help refine your market analysis and trading strategies.
הערות שחרור
OVERVIEWThe [blackcat] L1 Bullish Trend Indicator is designed to help traders identify bullish trends by analyzing volume-based indicators over multiple timeframes. This script calculates smoothed average participations and plots them as colored bands on the chart, providing clear visual cues for potential buy and sell opportunities. By combining short-term, mid-term, and long-term data, it offers a comprehensive view of market momentum 📈💹.
FEATURES
Calculates volume-based indicators using custom functions:
Volume Indicator: Based on price and volume data.
Smoothed Average Participation: Using Simple Moving Averages (SMAs).
Plots colored bands representing different timeframes:
Yellow: Short-term participation (Bullish Start).
Fuchsia: Short-term participation (Skyrocket).
Red: Mid-term participation (Mid-Term).
Blue: Long-term participation (Long-Term).
Displays buy ('Buy') and sell ('Sell') labels on the chart for quick identification 🏷️
Generates alerts based on crossover events between the short-term and long-term bands 🔔
HOW TO USE
Add the indicator to your TradingView chart by selecting it from the indicators list.
Adjust the following parameters to suit your preferences:
Short Term Length 1
Short Term Length 2
Mid Term Length
Long Term Length
Monitor the chart for buy and sell labels indicating potential trade opportunities.
Set up alerts based on the generated signals to receive notifications when conditions are met 📲.
Use the colored bands as additional context for trend analysis.
LIMITATIONS
The indicator relies heavily on volume data, which may not be reliable in all markets or assets.
False signals can occur in highly volatile or ranging markets 🌪️.
Users should always confirm signals with other forms of analysis before making trading decisions.
NOTES
Ensure that you have sufficient historical data available for accurate calculations.
Test the indicator thoroughly on demo accounts before applying it to live trading 🔍.
Customize the appearance and parameters as needed to fit your trading strategy.
סקריפט קוד פתוח
ברוח האמיתית של TradingView, יוצר הסקריפט הזה הפך אותו לקוד פתוח, כך שסוחרים יוכלו לעיין בו ולאמת את פעולתו. כל הכבוד למחבר! אמנם ניתן להשתמש בו בחינם, אך זכור כי פרסום חוזר של הקוד כפוף ל־כללי הבית שלנו.
Avoid losing contact!Don't miss out! The first and most important thing to do is to join my Discord chat now! Click here to start your adventure: discord.com/invite/ZTGpQJq 防止失联,请立即行动,加入本猫聊天群: discord.com/invite/ZTGpQJq
כתב ויתור
המידע והפרסומים אינם מיועדים להיות, ואינם מהווים, ייעוץ או המלצה פיננסית, השקעתית, מסחרית או מכל סוג אחר המסופקת או מאושרת על ידי TradingView. קרא עוד ב־תנאי השימוש.