PROTECTED SOURCE SCRIPT
Ultimate Market Rhythm Scanner FX
Ready to feel like a chart-wielding wizard? The Ultimate Market Rhythm Scanner FX is here to supercharge your Forex analysis by piping in multi-timeframe goodness from up to 10 OANDA currency pairs. You’ll see structure breakouts, Ichimoku signals, MACD pulses, RSI/Bollinger momentum waves, and candlestick patterns—all at once.
Think of it as your own personal mission control dashboard, scanning the FX galaxy and beaming back color-coded signals so you know instantly where the market action is hottest. Remember, to keep the data aligned, you’ll want to load this indicator on an OANDA FX pair chart (like OANDA:EURUSD) so everything lines up perfectly behind the scenes.
Key Features
Market Structure Wizardry
Locates pivot highs and lows (Higher High, Lower Low, etc.)
Spots breakouts above/below these pivots
Shouts out “CHoCH” (Change of Character) when structure flips from bullish to bearish (or vice versa)
If you want to understnd more about the market structure logic in this script check out my other script, it uses the same logic:

Tracks price above/below the Ichimoku Cloud
Flags Tenkan/Kijun crosses for bullish or bearish setups
MACD & SMI Insights
MACD line vs. Signal Cross & crossing the Zero line
SMI crosses in overbought/oversold “zones” (because pure oscillator mania is cool)
Momentum Radar
Mashes up RSI + Bollinger + Ichimoku for either “Bullish,” “Bearish,” or “Neutral”
Also checks a separate Daily timeframe for cosmic perspective
Candlestick Pattern Goodness
Detects common candle formations (Hammer, Hanging Man, Marubozu, etc.)
Tells you exactly how many bars ago they flashed their signals
Time Fade Magic
Recent signals shine bright
Older signals fade out like invisible ninjas after a user-defined number of bars
Explanation of Settings
Below lies the control panel for your new chart-snooping sidekick:
Symbol Settings (Symbol 1...Symbol 10)
Select multiple FX OANDA pairs (like OANDA:AUDUSD).
Each pair spawns a new column in the scanner table.
Ensure your chart is also set to an OANDA pair—the script only speaks “OANDA.”
Ichimoku Settings
Use Ichimoku Filter: Toggles everything Ichimoku.
conversionPeriods, basePeriods, laggingSpan2Periods, displacement: The classic Ichimoku parameters to mold your cloud magic.
Pivot Logic
Pivot Source: Wicks vs. Closes for pivot detection.
BOS Confirmation: If you prefer breakouts confirmed by wicks or closes.
Left Swing Length: Bars left for pivots.
Right Swing Length High / Low: Bars right for pivot confirmation.
Invert Right Swing in Bearish Trend: Auto-flip logic when gloom takes over. This means right swing size high value will become right swing size low value in a bearish trend (determined by latest CHoCH).
RSI & Bollinger
RSI Period: The heartbeat of RSI.
RSI Overbought / Oversold: Thresholds for RSI mania.
BB Length / StdDev: The Bollinger band radius for measuring price expansions.
MACD
fastLength, slowLength, signalLength: The trifecta that shapes your MACD wave.
SMI Settings
Nested variables for SMI’s K, D, and EMA lengths.
Overbought and Oversold levels for zone detection.
Time Display Settings
Fade out old signals: Turn the fade effect on/off.
Fade After X Bars: The number of bars after which signals do a ghost trick.
Fade Transparency: How ghostly (0–100) those old signals become.
Table Settings
Show Table: Summon or banish the entire scanner table.
Table Position: Choose the quadrant for your new data-loving sidekick.
Table Text Size: Big or small text for those crucial signals.
Table Layout
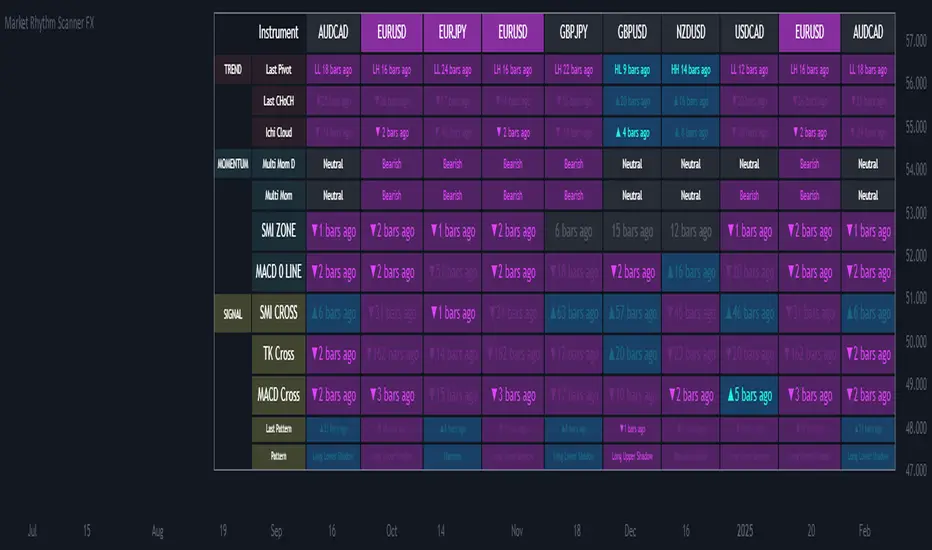
With “Show Table” on, a futuristic readout appears, listing:
Columns: Each symbol’s name runs across the top (up to 10).
Rows: A row for each technical aspect, such as:
Last Pivot (pivot) – The most recent pivot type (HH, HL, LH, LL) and how many bars ago.
Last CHoCH – Crows “▲/▼ X bars ago” if structure reversed.
Ichi Cloud (ichi) – Tells you if price soared above or dived below the Cloud.
Multi Mom D (momentum_d) – A daily momentum label (Bullish/Bearish/Neutral). It shows you daily momentum even on times frames lower than the daily. Multi Mom D is not reliable if the chart is on a time frame higher than the daily.
Multi Mom (momentum) – Current timeframe momentum label.
SMI ZONE (smizone) – If SMI’s in a bullish or bearish zone.
MACD 0 LINE (macdzero) – Number of bars since crossing zero.
SMI CROSS (smicross) – A bullish or bearish cross in overbought/oversold territory.
TK Cross (tk) – Tenkan/Kijun cross and how many bars ago.
MACD Cross (macd) – MACD crossing above/below its signal line.
Last Pattern (lastpat) – The candle pattern found and bars since it popped.
Pattern (pattype) – The name of that pattern (Hammer, Hanging Man, etc.).
Each cell can be tinted in a blue-ish glow for bullish vibes, or a purple shade for bearish signals. The “bars ago” text helps you see how fresh the signal is—fewer bars = more relevant.
Usage Notes
OANDA Chart is King
Always apply this indicator on an OANDA-based chart (e.g., OANDA:GBPJPY). If you deviate, the script might not retrieve data properly from the OANDA feed.
Symbol List
For each of the symbols inputs, pick your favorite currency crosses (all from the OANDA universe).
Timeframes
The script runs on your current chart’s timeframe for near-term action.
It simultaneously checks the daily timeframe to measure high-level momentum.
Fade-Out Feature
By default, signals older than 5 bars fade out. Adjust in “Time Display Settings” if you want them to linger.
Confluence is King
If a pivot breakout, bullish Ichimoku cross, and an SMI overbought cross all light up at once, you might have a short-term rocket on your hands. Always confirm with your trading plan!
Summary
Embrace your inner data nerd with the Market Rhythm Scanner FX—the ultimate multi-asset intelligence platform for OANDA Forex pairs. From subtle pivot changes to daily momentum shifts, from candle patterns to MACD fireworks, it’s all consolidated into one easy-to-digest control panel.
Step 1: Load up an OANDA chart (like “OANDA:EURUSD”).
Step 2: Enter your chosen OANDA pairs under “Symbol Settings.”
Step 3: Geek out over the instant real-time multi-indicator table, letting you see which instruments are sizzling or fizzling.
No more frantic tab-hopping. Save your mental bandwidth for the big decisions.
Let the Ultimate Market Rhythm Scanner FX be your ever-watchful sidekick, scanning the charts so you can conquer the Forex battlefield like the tech-savvy champion you are!
This script is free to use at present, but I reserve the right to move it behind a paywall in the future.
Think of it as your own personal mission control dashboard, scanning the FX galaxy and beaming back color-coded signals so you know instantly where the market action is hottest. Remember, to keep the data aligned, you’ll want to load this indicator on an OANDA FX pair chart (like OANDA:EURUSD) so everything lines up perfectly behind the scenes.
Key Features
Market Structure Wizardry
Locates pivot highs and lows (Higher High, Lower Low, etc.)
Spots breakouts above/below these pivots
Shouts out “CHoCH” (Change of Character) when structure flips from bullish to bearish (or vice versa)
If you want to understnd more about the market structure logic in this script check out my other script, it uses the same logic:
Tracks price above/below the Ichimoku Cloud
Flags Tenkan/Kijun crosses for bullish or bearish setups
MACD & SMI Insights
MACD line vs. Signal Cross & crossing the Zero line
SMI crosses in overbought/oversold “zones” (because pure oscillator mania is cool)
Momentum Radar
Mashes up RSI + Bollinger + Ichimoku for either “Bullish,” “Bearish,” or “Neutral”
Also checks a separate Daily timeframe for cosmic perspective
Candlestick Pattern Goodness
Detects common candle formations (Hammer, Hanging Man, Marubozu, etc.)
Tells you exactly how many bars ago they flashed their signals
Time Fade Magic
Recent signals shine bright
Older signals fade out like invisible ninjas after a user-defined number of bars
Explanation of Settings
Below lies the control panel for your new chart-snooping sidekick:
Symbol Settings (Symbol 1...Symbol 10)
Select multiple FX OANDA pairs (like OANDA:AUDUSD).
Each pair spawns a new column in the scanner table.
Ensure your chart is also set to an OANDA pair—the script only speaks “OANDA.”
Ichimoku Settings
Use Ichimoku Filter: Toggles everything Ichimoku.
conversionPeriods, basePeriods, laggingSpan2Periods, displacement: The classic Ichimoku parameters to mold your cloud magic.
Pivot Logic
Pivot Source: Wicks vs. Closes for pivot detection.
BOS Confirmation: If you prefer breakouts confirmed by wicks or closes.
Left Swing Length: Bars left for pivots.
Right Swing Length High / Low: Bars right for pivot confirmation.
Invert Right Swing in Bearish Trend: Auto-flip logic when gloom takes over. This means right swing size high value will become right swing size low value in a bearish trend (determined by latest CHoCH).
RSI & Bollinger
RSI Period: The heartbeat of RSI.
RSI Overbought / Oversold: Thresholds for RSI mania.
BB Length / StdDev: The Bollinger band radius for measuring price expansions.
MACD
fastLength, slowLength, signalLength: The trifecta that shapes your MACD wave.
SMI Settings
Nested variables for SMI’s K, D, and EMA lengths.
Overbought and Oversold levels for zone detection.
Time Display Settings
Fade out old signals: Turn the fade effect on/off.
Fade After X Bars: The number of bars after which signals do a ghost trick.
Fade Transparency: How ghostly (0–100) those old signals become.
Table Settings
Show Table: Summon or banish the entire scanner table.
Table Position: Choose the quadrant for your new data-loving sidekick.
Table Text Size: Big or small text for those crucial signals.
Table Layout
With “Show Table” on, a futuristic readout appears, listing:
Columns: Each symbol’s name runs across the top (up to 10).
Rows: A row for each technical aspect, such as:
Last Pivot (pivot) – The most recent pivot type (HH, HL, LH, LL) and how many bars ago.
Last CHoCH – Crows “▲/▼ X bars ago” if structure reversed.
Ichi Cloud (ichi) – Tells you if price soared above or dived below the Cloud.
Multi Mom D (momentum_d) – A daily momentum label (Bullish/Bearish/Neutral). It shows you daily momentum even on times frames lower than the daily. Multi Mom D is not reliable if the chart is on a time frame higher than the daily.
Multi Mom (momentum) – Current timeframe momentum label.
SMI ZONE (smizone) – If SMI’s in a bullish or bearish zone.
MACD 0 LINE (macdzero) – Number of bars since crossing zero.
SMI CROSS (smicross) – A bullish or bearish cross in overbought/oversold territory.
TK Cross (tk) – Tenkan/Kijun cross and how many bars ago.
MACD Cross (macd) – MACD crossing above/below its signal line.
Last Pattern (lastpat) – The candle pattern found and bars since it popped.
Pattern (pattype) – The name of that pattern (Hammer, Hanging Man, etc.).
Each cell can be tinted in a blue-ish glow for bullish vibes, or a purple shade for bearish signals. The “bars ago” text helps you see how fresh the signal is—fewer bars = more relevant.
Usage Notes
OANDA Chart is King
Always apply this indicator on an OANDA-based chart (e.g., OANDA:GBPJPY). If you deviate, the script might not retrieve data properly from the OANDA feed.
Symbol List
For each of the symbols inputs, pick your favorite currency crosses (all from the OANDA universe).
Timeframes
The script runs on your current chart’s timeframe for near-term action.
It simultaneously checks the daily timeframe to measure high-level momentum.
Fade-Out Feature
By default, signals older than 5 bars fade out. Adjust in “Time Display Settings” if you want them to linger.
Confluence is King
If a pivot breakout, bullish Ichimoku cross, and an SMI overbought cross all light up at once, you might have a short-term rocket on your hands. Always confirm with your trading plan!
Summary
Embrace your inner data nerd with the Market Rhythm Scanner FX—the ultimate multi-asset intelligence platform for OANDA Forex pairs. From subtle pivot changes to daily momentum shifts, from candle patterns to MACD fireworks, it’s all consolidated into one easy-to-digest control panel.
Step 1: Load up an OANDA chart (like “OANDA:EURUSD”).
Step 2: Enter your chosen OANDA pairs under “Symbol Settings.”
Step 3: Geek out over the instant real-time multi-indicator table, letting you see which instruments are sizzling or fizzling.
No more frantic tab-hopping. Save your mental bandwidth for the big decisions.
Let the Ultimate Market Rhythm Scanner FX be your ever-watchful sidekick, scanning the charts so you can conquer the Forex battlefield like the tech-savvy champion you are!
This script is free to use at present, but I reserve the right to move it behind a paywall in the future.
סקריפט מוגן
סקריפט זה פורסם כמקור סגור. עם זאת, תוכל להשתמש בו בחופשיות וללא כל מגבלות – למד עוד כאן
כתב ויתור
המידע והפרסומים אינם מיועדים להיות, ואינם מהווים, ייעוץ או המלצה פיננסית, השקעתית, מסחרית או מכל סוג אחר המסופקת או מאושרת על ידי TradingView. קרא עוד ב־תנאי השימוש.
סקריפט מוגן
סקריפט זה פורסם כמקור סגור. עם זאת, תוכל להשתמש בו בחופשיות וללא כל מגבלות – למד עוד כאן
כתב ויתור
המידע והפרסומים אינם מיועדים להיות, ואינם מהווים, ייעוץ או המלצה פיננסית, השקעתית, מסחרית או מכל סוג אחר המסופקת או מאושרת על ידי TradingView. קרא עוד ב־תנאי השימוש.