BORSA 321 - HTF Volume Delta Highlighter
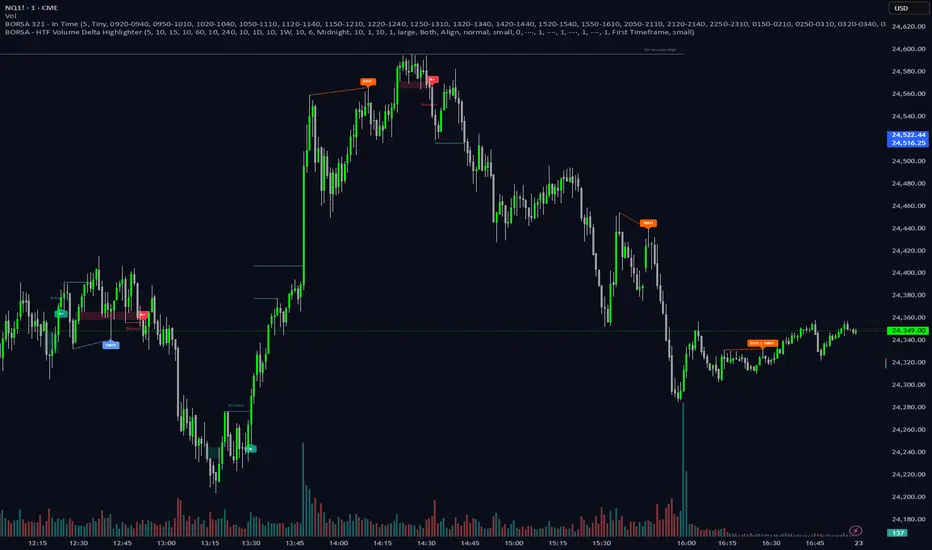
HTF Volume Delta Highlighter is a multi-timeframe tool that builds a compact higher-timeframe (HTF) candle panel on the right side of your chart and injects volume delta, fair value gaps (FVG) and volume imbalance (VI) directly into those candles.
Instead of constantly switching charts, you see:
Where buy vs sell volume is dominating on HTF
Which HTF candles left inefficiencies (FVG / VI)
Key open / high / low / close levels projected back onto your current timeframe
How much time is left for each HTF candle to close
All of this lives visually on your current chart, making it perfect for scalpers and intraday traders who rely on higher-timeframe context.
What It Shows
For up to six higher timeframes (default: 5m, 15m, 1H, 4H, 1D, 1W), the indicator plots:
1. HTF Candle Panel on the Right
Each HTF is drawn as a mini candle strip to the right of price.
You can control:
How many candles per HTF to display
Space between candles
Space between timeframes
Overall offset from current price
This creates a clean HTF “dashboard” without touching your main candles.
2. Volume Delta Inside Each HTF Candle
When delta mode is enabled:
Each HTF candle body is split into:
Buy volume segment (green)
Sell volume segment (red)
The split is proportional to cumulative buy vs sell volume across the entire HTF period.
Optionally, the delta value itself (buy volume − sell volume) is printed:
Positive delta inside the buy segment
Negative delta inside the sell segment
This gives a visual and numeric read of who is in control on that higher timeframe.
3. HTF Fair Value Gaps (FVG)
Within each HTF strip, the script detects and highlights fair value gaps:
Bullish FVG: shaded with a green tone, optionally labeled FVG+
Bearish FVG: shaded with a red tone, optionally labeled FVG-
A line is also drawn through the midpoint of the FVG zone.
These zones quickly show where price left inefficiencies on the higher timeframe that may act as magnets or reaction levels.
4. Volume Imbalance (VI) Zones
Between consecutive HTF candles, the script also marks volume imbalance zones:
Bullish VI zones shaded green (VI+)
Bearish VI zones shaded red (VI-)
These highlight thin or aggressively traded areas that often attract future interaction.
5. Trace Lines Back to Your Main Chart
From the most recent HTF candles, the indicator can project horizontal trace lines:
From Open, High, Low, Close of the monitored HTF candle
With separate styling for each (color, line style, width)
Optional price labels at the right edge for each level
You can choose whether these traces are anchored to the first selected timeframe or the last timeframe, giving you flexibility in what levels matter most.
6. Timeframe & Timer Labels
For each HTF strip, the indicator can show:
Timeframe label (e.g., 5m, 15m, 1H, 4H, 1D, 1W)
Countdown timer for the current HTF candle (time remaining until close)
Labels can appear at the top, bottom, or both ends of the HTF panel.
You can choose whether labels align across all HTFs or follow each strip’s own high/low.
7. Custom Daily Session Handling
For the daily timeframe, you can override the default daily open to match your session preference:
Midnight (standard calendar day)
08:30 New York time
09:30 New York time
The script then treats that custom time as the start of your “daily” candle — useful for traders who sync with cash session opens.
8. Day of Week Labels (For Daily)
On daily HTF candles, you can optionally print a day-of-week letter above the candle:
M, T, W, T, F, S, S
This gives a quick sense of where in the week the current candle sits.
Key Inputs & Customization
HTF 1–6 Enable & Timeframe
Turn each HTF strip on/off
Set timeframe (5m, 15m, 1H, 4H, 1D, 1W, etc.)
Choose how many candles per HTF to display
Max Sets
Limit how many HTFs are shown at once (e.g., only next 3 HTFs).
Styling
Body, border, and wick colors for bullish and bearish candles
Candle width, spacing, and panel offset
Label colors and sizes
Delta Settings
Toggle delta mode on/off
Toggle delta values text inside candles
Imbalance Settings
Toggle FVG on/off, with bullish/bearish colors, labels
Toggle Volume Imbalance on/off, with bullish/bearish colors, labels
Control label text size
Trace Settings
Turn trace lines on/off
Customize style, color, and thickness for O/H/L/C
Choose whether to anchor traces to the first or last timeframe
Label & Timer Settings
Enable/disable HTF labels and timers
Choose label position: Top / Bottom / Both
Alignment mode: Align all strips or Follow Candles
If the chosen HTF isn’t valid for the current chart (not a proper multiple or too low), the script will show a clear on-chart message telling you to increase your chart timeframe to match the selected HTF requirements.
How It Helps Traders
Scalpers & intraday traders can stay on their low timeframe (e.g., 1m / 3m / 5m) while still seeing:
Where HTF buy/sell volume is dominant
Which HTF candles left inefficiencies that may later act as magnets or rejection zones
The exact HTF O/H/L/C levels currently active
How much time remains before the HTF bar closes (key for timing entries around closes).
Swing traders can use it to track daily and weekly HTF structure and delta while drilling down to lower timeframes for precise execution.
סקריפט להזמנה בלבד
רק משתמשים שאושרו על ידי המחבר יכולים לגשת לסקריפט הזה. יהיה עליך לשלוח בקשת גישה ולקבל אישור לשימוש. בדרך כלל, הגישה ניתנת לאחר תשלום. למידע נוסף, עקוב אחר ההוראות של היוצר בהמשך או צור קשר עם borsa321 ישירות.
TradingView לא ממליצה לשלם עבור סקריפט או להשתמש בו אלא אם כן אתה סומך לחלוטין על המחבר שלו ומבין כיצד הוא פועל. ייתכן שתוכל גם למצוא חלופות חינמיות וקוד פתוח ב-סקריפטים הקהילתיים שלנו.
הוראות המחבר
כתב ויתור
סקריפט להזמנה בלבד
רק משתמשים שאושרו על ידי המחבר יכולים לגשת לסקריפט הזה. יהיה עליך לשלוח בקשת גישה ולקבל אישור לשימוש. בדרך כלל, הגישה ניתנת לאחר תשלום. למידע נוסף, עקוב אחר ההוראות של היוצר בהמשך או צור קשר עם borsa321 ישירות.
TradingView לא ממליצה לשלם עבור סקריפט או להשתמש בו אלא אם כן אתה סומך לחלוטין על המחבר שלו ומבין כיצד הוא פועל. ייתכן שתוכל גם למצוא חלופות חינמיות וקוד פתוח ב-סקריפטים הקהילתיים שלנו.