OPEN-SOURCE SCRIPT
מעודכן RSI Candle 12-Band Spectrum
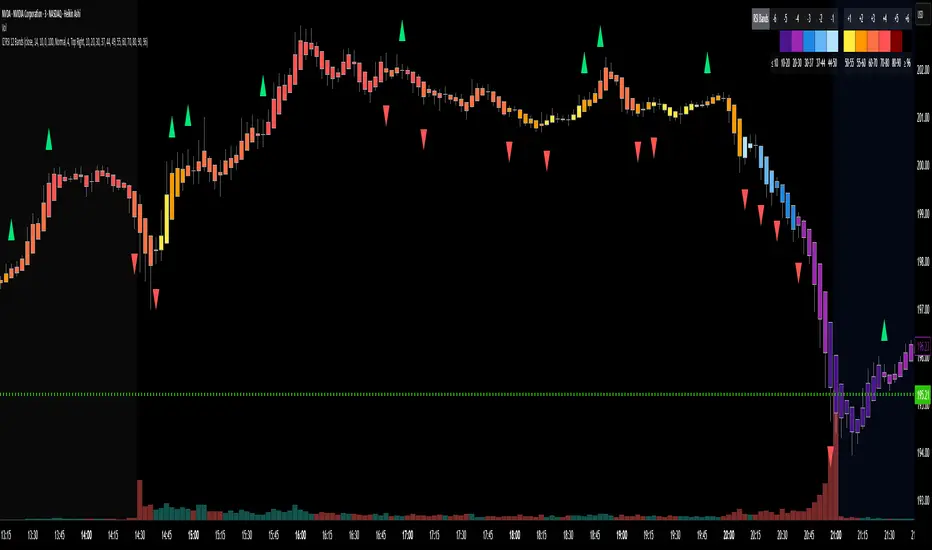
Experience RSI like never before. This multi-band visualizer transforms relative strength into a living color map — directly over price action — revealing momentum shifts long before traditional RSI signals.
🔹 12 Dynamic RSI Bands – A full emotional spectrum from oversold to overbought, colored from deep blue to burning red.
🔹 Adaptive Pulse System – Highlights every shift in RSI state with an intelligent fade-out pulse that measures the strength of each rotation.
🔹 Precision Legend Display – Clear RSI cutoff zones with user-defined thresholds and color ranges.
🔹 Multi-Timeframe Engine – Optionally view higher-timeframe RSI context while scalping lower frames.
🔹 Stealth Mode – Borders-only visualization for minimal chart impact on dark themes.
🔹 Complete Customization – Adjustable band levels, color palettes, and fade behavior.
🧠 Designed for professional traders who move with rhythm, not randomness.
הערות שחרור
🆕 Update v2.0 — “No More Floating Arrows” ✅Complete overhaul of the RSI band-change arrow system for perfect precision.
Arrows are now candle-anchored (abovebar / belowbar) and share the main price scale — no more floating mid-screen.
Cleaner visuals, lighter performance, and 100% accurate alignment across all chart types and timeframes.
סקריפט קוד פתוח
ברוח האמיתית של TradingView, יוצר הסקריפט הזה הפך אותו לקוד פתוח, כך שסוחרים יוכלו לעיין בו ולאמת את פעולתו. כל הכבוד למחבר! אמנם ניתן להשתמש בו בחינם, אך זכור כי פרסום חוזר של הקוד כפוף ל־כללי הבית שלנו.
כתב ויתור
המידע והפרסומים אינם מיועדים להיות, ואינם מהווים, ייעוץ או המלצה פיננסית, השקעתית, מסחרית או מכל סוג אחר המסופקת או מאושרת על ידי TradingView. קרא עוד ב־תנאי השימוש.