OPEN-SOURCE SCRIPT
מעודכן RSI chop filter
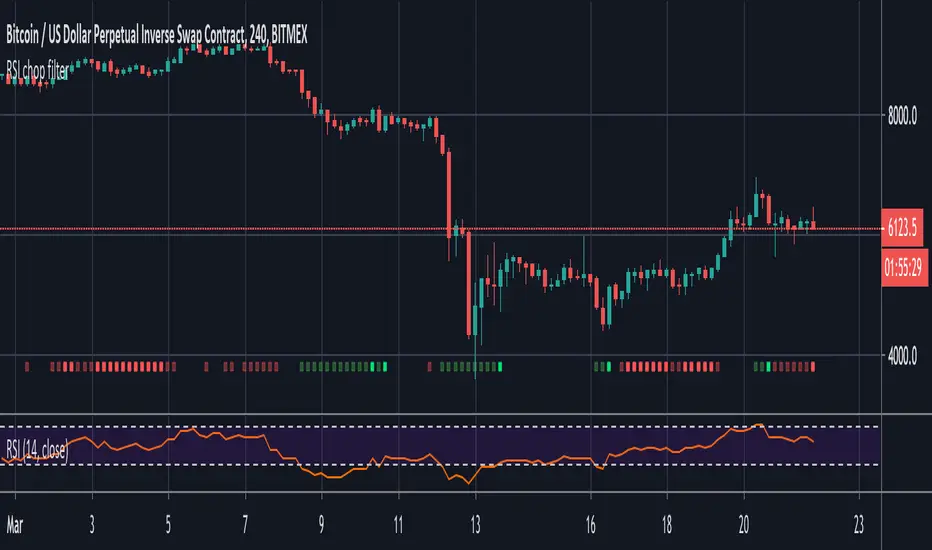
This demonstrates how you might filter your signals using RSI, but the same technique could be applied to Stochastic RSI and any other oscillator that has overbought and oversold conditions.
Use it as a visual indicator to determine when to enter a trade:
Red = Chop zone (no trade)
Bright red = Tight chop (dear god stay away)
Green = Overbought or oversold (signals permitted)
Bright green = Crossing up/down (take the trade)
To apply the filter, simply add 'and not chop' after your conditions as seen in the commented out example.
הערות שחרור
Swapping out a variable. A minor improvement.סקריפט קוד פתוח
ברוח האמיתית של TradingView, יוצר הסקריפט הזה הפך אותו לקוד פתוח, כך שסוחרים יוכלו לעיין בו ולאמת את פעולתו. כל הכבוד למחבר! אמנם ניתן להשתמש בו בחינם, אך זכור כי פרסום חוזר של הקוד כפוף ל־כללי הבית שלנו.
כתב ויתור
המידע והפרסומים אינם מיועדים להיות, ואינם מהווים, ייעוץ או המלצה פיננסית, השקעתית, מסחרית או מכל סוג אחר המסופקת או מאושרת על ידי TradingView. קרא עוד ב־תנאי השימוש.
סקריפט קוד פתוח
ברוח האמיתית של TradingView, יוצר הסקריפט הזה הפך אותו לקוד פתוח, כך שסוחרים יוכלו לעיין בו ולאמת את פעולתו. כל הכבוד למחבר! אמנם ניתן להשתמש בו בחינם, אך זכור כי פרסום חוזר של הקוד כפוף ל־כללי הבית שלנו.
כתב ויתור
המידע והפרסומים אינם מיועדים להיות, ואינם מהווים, ייעוץ או המלצה פיננסית, השקעתית, מסחרית או מכל סוג אחר המסופקת או מאושרת על ידי TradingView. קרא עוד ב־תנאי השימוש.