(CM|DB) Caruso Market Dashboard
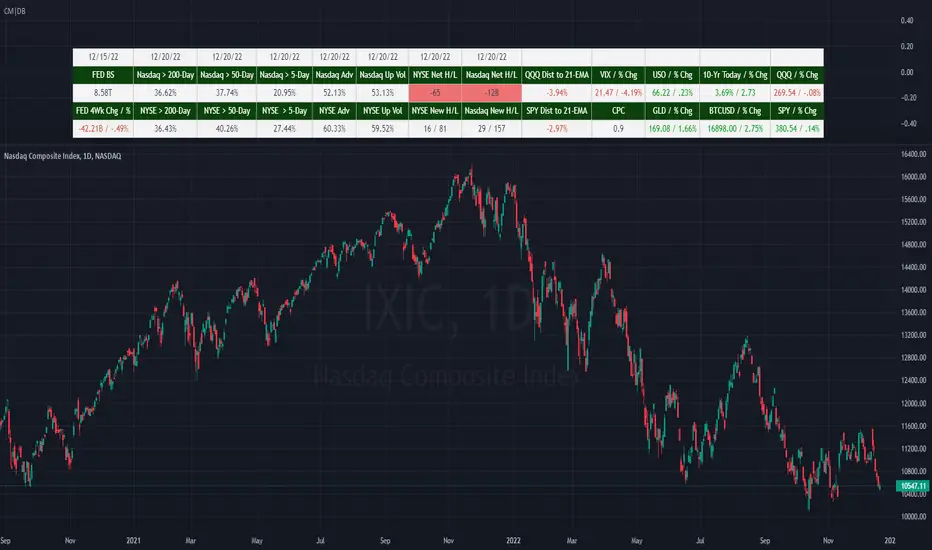
Presented for both the Nasdaq and NYSE composites and updated at the end of each trading day, the market breadth section shows:
· the number of net 52-week highs and lows
· the actual number of new 52-week highs and 52-week lows.
· The percentage of volume traded on up stocks vs. total volume
· The percentage of stocks advancing vs. all stocks
· Percentage of stocks above their 5-day average
· Percentage of stocks above their 50-day average
· Percentage of stocks above their 200-day average
In addition to presenting all of this valuable information in a table, users can hide the table and plot each market and economic data point. This is very helpful when viewing trends as well as overbought and oversold levels for these data points.
■ Intraday support.
■ Add option to change market data symbols.
■ The SPY cell now correctly displays text green or red depending on the daily change.
■ New symbol names now display correctly if the dashboard's breadth stats are not shown
סקריפט להזמנה בלבד
רק משתמשים שאושרו על ידי המחבר יכולים לגשת לסקריפט הזה. יהיה עליך לשלוח בקשת גישה ולקבל אישור לשימוש. בדרך כלל, הגישה ניתנת לאחר תשלום. למידע נוסף, עקוב אחר ההוראות של היוצר בהמשך או צור קשר עם CarusoInsights ישירות.
TradingView לא ממליצה לשלם עבור סקריפט או להשתמש בו אלא אם כן אתה סומך לחלוטין על המחבר שלו ומבין כיצד הוא פועל. ייתכן שתוכל גם למצוא חלופות חינמיות וקוד פתוח ב-סקריפטים הקהילתיים שלנו.
הוראות המחבר
כתב ויתור
סקריפט להזמנה בלבד
רק משתמשים שאושרו על ידי המחבר יכולים לגשת לסקריפט הזה. יהיה עליך לשלוח בקשת גישה ולקבל אישור לשימוש. בדרך כלל, הגישה ניתנת לאחר תשלום. למידע נוסף, עקוב אחר ההוראות של היוצר בהמשך או צור קשר עם CarusoInsights ישירות.
TradingView לא ממליצה לשלם עבור סקריפט או להשתמש בו אלא אם כן אתה סומך לחלוטין על המחבר שלו ומבין כיצד הוא פועל. ייתכן שתוכל גם למצוא חלופות חינמיות וקוד פתוח ב-סקריפטים הקהילתיים שלנו.