OPEN-SOURCE SCRIPT
EMP Probabilistic [CHE]
Part 1 — For Traders (Practical Overview, no formulas)
What this tool does
EMP Probabilistic \[CHE] turns raw price action into a clean, probability-aware map. It builds two adaptive bands around the session open of a higher timeframe you choose (called the S-timeframe) and highlights a robust median threshold. At a glance you know:
Where price has recently tended to stay,
Whether current momentum sits above or below the median, and
A live Long vs. Short probability based on recent outcomes.
Why it improves decisions
Objective context in any regime: The nonparametric band comes straight from recent market behavior, without assuming a particular distribution.
Volatility-aware risk lens: The parametric band adapts to current volatility, helping you judge stretch and room for continuation or snap-back.
No lookahead: All stats update only after an S-bar is finished. That means the panel reflects information you truly had at that time.
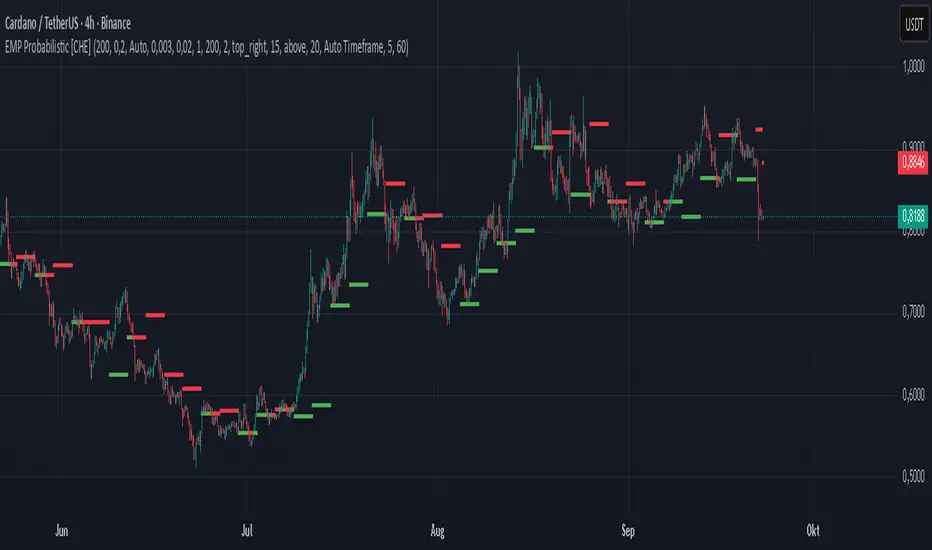
How to read the chart
Orange band = empirical, distribution-free range derived from recent session returns (nonparametric).
Teal band = volatility-scaled range around the session open (parametric).
Median dots: green when close is above the median threshold, red when below.
Info panel: shows the active S-timeframe, window sizes, live coverage for both bands, the internal width parameter and volatility estimate, plus a one-line summary.
Probability label: “Long XX% • Short YY%” — a simple read on the recent balance of up vs. down S-bars.
How to use it (quick start)
1. Choose S-timeframe with Auto, Multiplier, or Manual. “Auto” scales your chart TF up to a sensible higher step.
2. Set alpha to control how tight the inner band should be. A typical value gives you a comfortable center zone without cutting off healthy trends.
3. Trade the context:
Trend-following: Prefer longs when price holds above the median; prefer shorts when it stays below.
Mean-reversion: Fade moves near the outer edges during ranges; look for reversion back toward the median.
Breakout filter: Require closes that push and hold beyond the volatility band for momentum plays; avoid noise when price chops inside the middle of the orange band.
Risk management made practical
Size positions relative to the teal band width to keep risk consistent across instruments and regimes.
For stops, many traders set them just beyond the opposite orange bound or use a fraction of the teal band.
Watch the panel’s coverage readouts and Brier score; when they deteriorate, the market may be shifting — reduce size or demand stronger confirmation.
Suggested presets
Scalping (Crypto/FX): Auto S-TF, alpha around a fifth, calibration window near two hundred, RS volatility, metrics window near two hundred.
Intraday Futures: Multiplier 3–5× your chart TF; similar alpha and window sizes; RS volatility is a solid default.
Swing/Equities: S-TF at least daily; test both RS and GK volatility modes; keep windows on the larger side for stability.
What makes it different
Two complementary lenses: a distribution-free read of recent behavior and a volatility-scaled read for risk and stretch.
Self-calibrating width: the parametric band quietly nudges its internal multiplier so actual coverage tracks your target.
Clean UX: grouped inputs, tooltips, an info panel that tells you what’s going on, and a simple median bias you can act on.
Repainting & timing
The logic updates only when the S-bar closes. On lower-timeframe charts you’ll see intrabar flips of the dot color — that’s just live price moving around. For strict signals, confirm on S-bar close.
Friendly note (not financial advice)
Use this as a context engine. It won’t predict the future, but it will keep you on the right side of probability and volatility more often, which is exactly where consistency starts.
Part 2 — Under the Hood (Conceptual, no formulas)
Data and timeframe design
The script works on a higher S-timeframe you select. It fetches the open, high, low, close, and time of that S-bar. Internally, it only updates its rolling windows after an S-bar has finished. It then pushes the previous S-bar’s statistics into its arrays. That design removes lookahead and keeps the metrics out-of-sample relative to the current S-bar.
Nonparametric band (distribution-free)
The orange band comes from the empirical distribution of recent session-level close-minus-open moves. The script keeps a rolling window, sorts a safe copy, and reads three key points: a lower bound, a median, and an upper bound. Because it’s based purely on observed outcomes, it adapts naturally to skew, fat tails, and regime shifts without assuming any particular shape. The orange range shows “where price has tended to live” lately on the chosen S-timeframe.
Parametric band (volatility-scaled)
The teal band models log-space variability around the session open using one of two well-known OHLC volatility estimators: Rogers–Satchell or Garman–Klass. Each estimator contributes a per-bar variance figure; the script averages these across the rolling window to form a current volatility scale. It then builds a symmetric band around the session open in price space. This gives you a volatility-aware notion of stretch that complements the distribution-free orange band.
Self-calibration of band width
The teal band has an internal width multiplier. After each completed S-bar the script checks whether the realized move stayed inside that band. If the band was too tight, the multiplier is nudged upward; if it was too loose, it’s eased downward. A simple learning rate governs how quickly it adapts. Over time this keeps the realized inside-coverage close to the target implied by your alpha setting, without you having to hand-tune anything.
Long/Short probability and calibration quality
The Long vs. Short probability is a transparent statistic: it’s just the recent fraction of up sessions in the rolling window. It is not a complex model — and that’s the point. You get an honest, intuitive read on directional tendency.
To monitor how well this simple probability lines up with reality, the script tracks a Brier-style score over a separate metrics window. Lower is better: it means your recent probability read has matched outcomes more closely.
Coverage tracking for both bands
The panel reports coverage for the orange band (nonparametric) and the teal band (parametric). These are rolling averages of how often recent S-bar moves landed inside each band. Watching these two numbers tells you whether market behavior still aligns with the recent distribution and with the current volatility model.
Why it doesn’t repaint
Because the arrays update only when an S-bar closes and only push the previous bar’s stats, the panel and metrics reflect information you had at the time. Intrabar visuals can change while a bar is forming — that’s expected — but the decision framework itself is anchored to completed S-bars.
Performance and practicality
The heaviest step is sorting a copy of the window for the nonparametric band. With typical window sizes this stays responsive on TradingView. The volatility estimators and rolling averages are lightweight. Inputs are grouped with clear tooltips so you can tune without hunting.
Limitations and good practice
In thin or gappy markets the bands can jump; consider a larger window or a higher S-timeframe.
During violent regime shifts, shorten the window and increase the learning rate slightly so the teal band catches up faster — but don’t overdo it, or you’ll chase noise.
The Long/Short probability is intentionally simple; it’s a context indicator, not a standalone signal factory. Combine it with structure, volume, or your execution rules.
Takeaway
Under the hood, the script blends empirical behavior and volatility scaling, then self-calibrates so the teal band’s real-world coverage stays near your target. You get clarity, consistency, and a dashboard that tells you when its own assumptions are holding up — exactly what you need to trade with confidence.
Disclaimer
The content provided, including all code and materials, is strictly for educational and informational purposes only. It is not intended as, and should not be interpreted as, financial advice, a recommendation to buy or sell any financial instrument, or an offer of any financial product or service. All strategies, tools, and examples discussed are provided for illustrative purposes to demonstrate coding techniques and the functionality of Pine Script within a trading context.
Any results from strategies or tools provided are hypothetical, and past performance is not indicative of future results. Trading and investing involve high risk, including the potential loss of principal, and may not be suitable for all individuals. Before making any trading decisions, please consult with a qualified financial professional to understand the risks involved.
By using this script, you acknowledge and agree that any trading decisions are made solely at your discretion and risk.
Best regards and happy trading
Chervolino
What this tool does
EMP Probabilistic \[CHE] turns raw price action into a clean, probability-aware map. It builds two adaptive bands around the session open of a higher timeframe you choose (called the S-timeframe) and highlights a robust median threshold. At a glance you know:
Where price has recently tended to stay,
Whether current momentum sits above or below the median, and
A live Long vs. Short probability based on recent outcomes.
Why it improves decisions
Objective context in any regime: The nonparametric band comes straight from recent market behavior, without assuming a particular distribution.
Volatility-aware risk lens: The parametric band adapts to current volatility, helping you judge stretch and room for continuation or snap-back.
No lookahead: All stats update only after an S-bar is finished. That means the panel reflects information you truly had at that time.
How to read the chart
Orange band = empirical, distribution-free range derived from recent session returns (nonparametric).
Teal band = volatility-scaled range around the session open (parametric).
Median dots: green when close is above the median threshold, red when below.
Info panel: shows the active S-timeframe, window sizes, live coverage for both bands, the internal width parameter and volatility estimate, plus a one-line summary.
Probability label: “Long XX% • Short YY%” — a simple read on the recent balance of up vs. down S-bars.
How to use it (quick start)
1. Choose S-timeframe with Auto, Multiplier, or Manual. “Auto” scales your chart TF up to a sensible higher step.
2. Set alpha to control how tight the inner band should be. A typical value gives you a comfortable center zone without cutting off healthy trends.
3. Trade the context:
Trend-following: Prefer longs when price holds above the median; prefer shorts when it stays below.
Mean-reversion: Fade moves near the outer edges during ranges; look for reversion back toward the median.
Breakout filter: Require closes that push and hold beyond the volatility band for momentum plays; avoid noise when price chops inside the middle of the orange band.
Risk management made practical
Size positions relative to the teal band width to keep risk consistent across instruments and regimes.
For stops, many traders set them just beyond the opposite orange bound or use a fraction of the teal band.
Watch the panel’s coverage readouts and Brier score; when they deteriorate, the market may be shifting — reduce size or demand stronger confirmation.
Suggested presets
Scalping (Crypto/FX): Auto S-TF, alpha around a fifth, calibration window near two hundred, RS volatility, metrics window near two hundred.
Intraday Futures: Multiplier 3–5× your chart TF; similar alpha and window sizes; RS volatility is a solid default.
Swing/Equities: S-TF at least daily; test both RS and GK volatility modes; keep windows on the larger side for stability.
What makes it different
Two complementary lenses: a distribution-free read of recent behavior and a volatility-scaled read for risk and stretch.
Self-calibrating width: the parametric band quietly nudges its internal multiplier so actual coverage tracks your target.
Clean UX: grouped inputs, tooltips, an info panel that tells you what’s going on, and a simple median bias you can act on.
Repainting & timing
The logic updates only when the S-bar closes. On lower-timeframe charts you’ll see intrabar flips of the dot color — that’s just live price moving around. For strict signals, confirm on S-bar close.
Friendly note (not financial advice)
Use this as a context engine. It won’t predict the future, but it will keep you on the right side of probability and volatility more often, which is exactly where consistency starts.
Part 2 — Under the Hood (Conceptual, no formulas)
Data and timeframe design
The script works on a higher S-timeframe you select. It fetches the open, high, low, close, and time of that S-bar. Internally, it only updates its rolling windows after an S-bar has finished. It then pushes the previous S-bar’s statistics into its arrays. That design removes lookahead and keeps the metrics out-of-sample relative to the current S-bar.
Nonparametric band (distribution-free)
The orange band comes from the empirical distribution of recent session-level close-minus-open moves. The script keeps a rolling window, sorts a safe copy, and reads three key points: a lower bound, a median, and an upper bound. Because it’s based purely on observed outcomes, it adapts naturally to skew, fat tails, and regime shifts without assuming any particular shape. The orange range shows “where price has tended to live” lately on the chosen S-timeframe.
Parametric band (volatility-scaled)
The teal band models log-space variability around the session open using one of two well-known OHLC volatility estimators: Rogers–Satchell or Garman–Klass. Each estimator contributes a per-bar variance figure; the script averages these across the rolling window to form a current volatility scale. It then builds a symmetric band around the session open in price space. This gives you a volatility-aware notion of stretch that complements the distribution-free orange band.
Self-calibration of band width
The teal band has an internal width multiplier. After each completed S-bar the script checks whether the realized move stayed inside that band. If the band was too tight, the multiplier is nudged upward; if it was too loose, it’s eased downward. A simple learning rate governs how quickly it adapts. Over time this keeps the realized inside-coverage close to the target implied by your alpha setting, without you having to hand-tune anything.
Long/Short probability and calibration quality
The Long vs. Short probability is a transparent statistic: it’s just the recent fraction of up sessions in the rolling window. It is not a complex model — and that’s the point. You get an honest, intuitive read on directional tendency.
To monitor how well this simple probability lines up with reality, the script tracks a Brier-style score over a separate metrics window. Lower is better: it means your recent probability read has matched outcomes more closely.
Coverage tracking for both bands
The panel reports coverage for the orange band (nonparametric) and the teal band (parametric). These are rolling averages of how often recent S-bar moves landed inside each band. Watching these two numbers tells you whether market behavior still aligns with the recent distribution and with the current volatility model.
Why it doesn’t repaint
Because the arrays update only when an S-bar closes and only push the previous bar’s stats, the panel and metrics reflect information you had at the time. Intrabar visuals can change while a bar is forming — that’s expected — but the decision framework itself is anchored to completed S-bars.
Performance and practicality
The heaviest step is sorting a copy of the window for the nonparametric band. With typical window sizes this stays responsive on TradingView. The volatility estimators and rolling averages are lightweight. Inputs are grouped with clear tooltips so you can tune without hunting.
Limitations and good practice
In thin or gappy markets the bands can jump; consider a larger window or a higher S-timeframe.
During violent regime shifts, shorten the window and increase the learning rate slightly so the teal band catches up faster — but don’t overdo it, or you’ll chase noise.
The Long/Short probability is intentionally simple; it’s a context indicator, not a standalone signal factory. Combine it with structure, volume, or your execution rules.
Takeaway
Under the hood, the script blends empirical behavior and volatility scaling, then self-calibrates so the teal band’s real-world coverage stays near your target. You get clarity, consistency, and a dashboard that tells you when its own assumptions are holding up — exactly what you need to trade with confidence.
Disclaimer
The content provided, including all code and materials, is strictly for educational and informational purposes only. It is not intended as, and should not be interpreted as, financial advice, a recommendation to buy or sell any financial instrument, or an offer of any financial product or service. All strategies, tools, and examples discussed are provided for illustrative purposes to demonstrate coding techniques and the functionality of Pine Script within a trading context.
Any results from strategies or tools provided are hypothetical, and past performance is not indicative of future results. Trading and investing involve high risk, including the potential loss of principal, and may not be suitable for all individuals. Before making any trading decisions, please consult with a qualified financial professional to understand the risks involved.
By using this script, you acknowledge and agree that any trading decisions are made solely at your discretion and risk.
Best regards and happy trading
Chervolino
סקריפט קוד פתוח
ברוח האמיתית של TradingView, יוצר הסקריפט הזה הפך אותו לקוד פתוח, כך שסוחרים יוכלו לעיין בו ולאמת את פעולתו. כל הכבוד למחבר! אמנם ניתן להשתמש בו בחינם, אך זכור כי פרסום חוזר של הקוד כפוף ל־כללי הבית שלנו.
כתב ויתור
המידע והפרסומים אינם מיועדים להיות, ואינם מהווים, ייעוץ או המלצה פיננסית, השקעתית, מסחרית או מכל סוג אחר המסופקת או מאושרת על ידי TradingView. קרא עוד ב־תנאי השימוש.