OPEN-SOURCE SCRIPT
Dynamic Price Zone
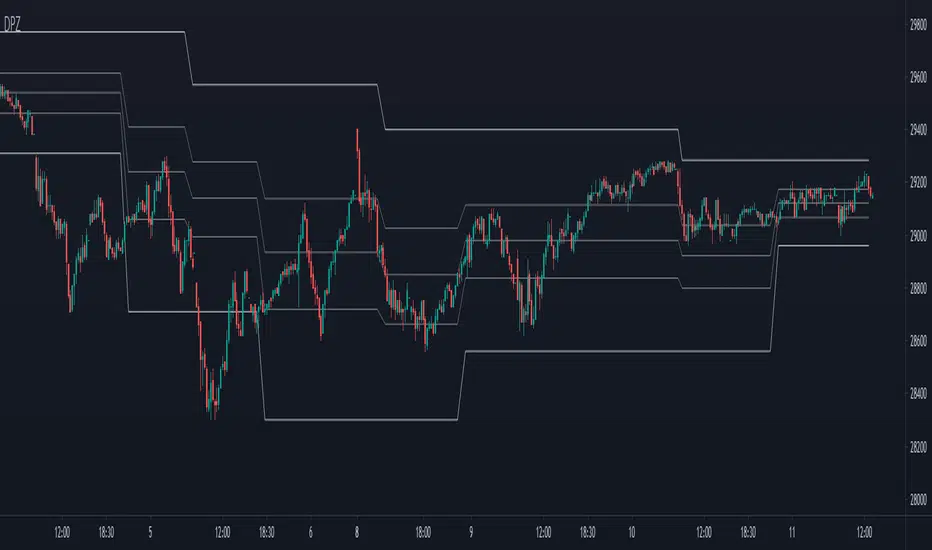
This indicator dynamically divides the price range into six zones.
1. Over Resistance (Strong up trend)
2. UpperMiddle to Resistance
3. Middle to UpperMiddle
4. Middle to LowerMiidle
5. LowerMiddle to Support
6. Under Support (Strong down Trend)
Resistance and Support are calculated by HMA.
Usage:
It is recommended to use this indicator on the higher time frames.
The image is 15 minutes chart and resolution 1hour for indicator.
- Pay attention to whether the range from resistance to support is shrinking or expanding!
- A major trend begins with a break in resistance and support.
- The five lines also work as a support or resistance.
- When the zone changes, the price is likely to reach the next line.
- UpperMiddle and LowerMiddle settings can be selected from 3 types.
- 75%, 66%, 61.8%(fibonacci) for UpperMiddle.
סקריפט קוד פתוח
ברוח האמיתית של TradingView, יוצר הסקריפט הזה הפך אותו לקוד פתוח, כך שסוחרים יוכלו לעיין בו ולאמת את פעולתו. כל הכבוד למחבר! אמנם ניתן להשתמש בו בחינם, אך זכור כי פרסום חוזר של הקוד כפוף ל־כללי הבית שלנו.
כתב ויתור
המידע והפרסומים אינם מיועדים להיות, ואינם מהווים, ייעוץ או המלצה פיננסית, השקעתית, מסחרית או מכל סוג אחר המסופקת או מאושרת על ידי TradingView. קרא עוד ב־תנאי השימוש.