OPEN-SOURCE SCRIPT
Market Pulse Dip Radar
This indicator is designed to help traders spot meaningful dips in price and then evaluate whether those dips are worth trading or not. It doesn’t just mark a dip; it also helps with risk management, trade planning, and filtering out weak signals.
Here’s how it works:
First, it looks at the recent high price and checks how much the market has dropped from that high. If the drop is larger than the minimum percentage you set, it marks it as a potential dip.
Next, it checks the trend structure by using two moving averages (a fast one and a slow one). If the fast average is below the slow average, it means the market is in a weaker structure, and that dip is considered more valid.
On top of that, you can enable a multi-timeframe filter. For example, if you are trading on the 15-minute chart, you can ask the indicator to confirm that the 1-hour trend is also supportive before showing you a dip. This helps avoid trading against the bigger trend.
Risk management is built in. The indicator automatically suggests a stop-loss by combining volatility (ATR) and recent swing lows. It then draws three profit target levels (1x risk, 2x risk, and 3x risk). This makes it easier to plan where to exit if the trade works.
A key part of this tool is the confidence score. Each dip signal is rated from 0 to 100. The score depends on how deep the dip is, how far apart the moving averages are, how healthy volatility is, and whether the higher timeframe supports the trade. The score is then labeled as High, Medium, Low, or Wait. This helps traders focus only on the stronger setups.
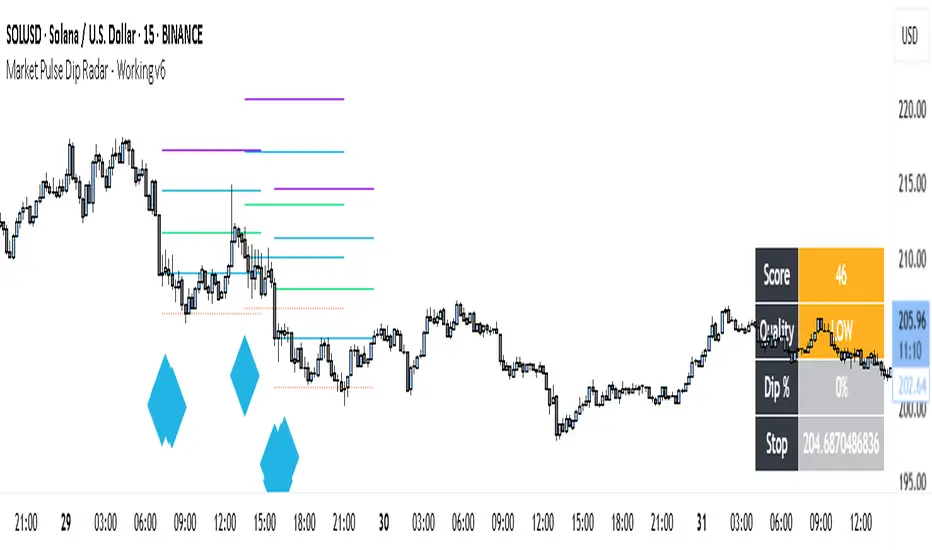
On the chart, dip signals are marked with a diamond shape under the bars. The color of the diamond tells you if it’s high, medium, or low quality. When a signal appears, the indicator also plots horizontal lines for the entry, stop, and targets.
To make it easier to read, there is also a dashboard box that shows the current score, quality, dip percentage, and suggested stop-loss. This means you don’t have to calculate or check different things yourself – everything is visible in one place.
Finally, it comes with alerts. You can set alerts for when a dip signal happens, or when it’s medium or high confidence. This way, you don’t need to stare at charts all day; TradingView can notify you.
So in short, this tool:
• Finds dips based on your rules.
• Filters them using structure, volatility, and higher timeframe trend.
• Suggests stop-loss and profit targets.
• Rates each dip with a confidence score.
• Shows all this info in a clean dashboard and alerts you when it happens.
👉 Do you want me to now explain how a trader would actually use it in practice (step by step, from signal to trade)?
Here’s how it works:
First, it looks at the recent high price and checks how much the market has dropped from that high. If the drop is larger than the minimum percentage you set, it marks it as a potential dip.
Next, it checks the trend structure by using two moving averages (a fast one and a slow one). If the fast average is below the slow average, it means the market is in a weaker structure, and that dip is considered more valid.
On top of that, you can enable a multi-timeframe filter. For example, if you are trading on the 15-minute chart, you can ask the indicator to confirm that the 1-hour trend is also supportive before showing you a dip. This helps avoid trading against the bigger trend.
Risk management is built in. The indicator automatically suggests a stop-loss by combining volatility (ATR) and recent swing lows. It then draws three profit target levels (1x risk, 2x risk, and 3x risk). This makes it easier to plan where to exit if the trade works.
A key part of this tool is the confidence score. Each dip signal is rated from 0 to 100. The score depends on how deep the dip is, how far apart the moving averages are, how healthy volatility is, and whether the higher timeframe supports the trade. The score is then labeled as High, Medium, Low, or Wait. This helps traders focus only on the stronger setups.
On the chart, dip signals are marked with a diamond shape under the bars. The color of the diamond tells you if it’s high, medium, or low quality. When a signal appears, the indicator also plots horizontal lines for the entry, stop, and targets.
To make it easier to read, there is also a dashboard box that shows the current score, quality, dip percentage, and suggested stop-loss. This means you don’t have to calculate or check different things yourself – everything is visible in one place.
Finally, it comes with alerts. You can set alerts for when a dip signal happens, or when it’s medium or high confidence. This way, you don’t need to stare at charts all day; TradingView can notify you.
So in short, this tool:
• Finds dips based on your rules.
• Filters them using structure, volatility, and higher timeframe trend.
• Suggests stop-loss and profit targets.
• Rates each dip with a confidence score.
• Shows all this info in a clean dashboard and alerts you when it happens.
👉 Do you want me to now explain how a trader would actually use it in practice (step by step, from signal to trade)?
סקריפט קוד פתוח
ברוח האמיתית של TradingView, יוצר הסקריפט הזה הפך אותו לקוד פתוח, כך שסוחרים יוכלו לעיין בו ולאמת את פעולתו. כל הכבוד למחבר! אמנם ניתן להשתמש בו בחינם, אך זכור כי פרסום חוזר של הקוד כפוף ל־כללי הבית שלנו.
Trade forex, indices, stocks and metals with up to US$100.000 in company's funding.
Complete a challenge to access funding or go for instant deposit.
Trading involves substantial risk. Not financial advice
Complete a challenge to access funding or go for instant deposit.
Trading involves substantial risk. Not financial advice
כתב ויתור
המידע והפרסומים אינם מיועדים להיות, ואינם מהווים, ייעוץ או המלצה פיננסית, השקעתית, מסחרית או מכל סוג אחר המסופקת או מאושרת על ידי TradingView. קרא עוד ב־תנאי השימוש.