OPEN-SOURCE SCRIPT
Spider Lines For Bitcoin (Daily And Weekly)
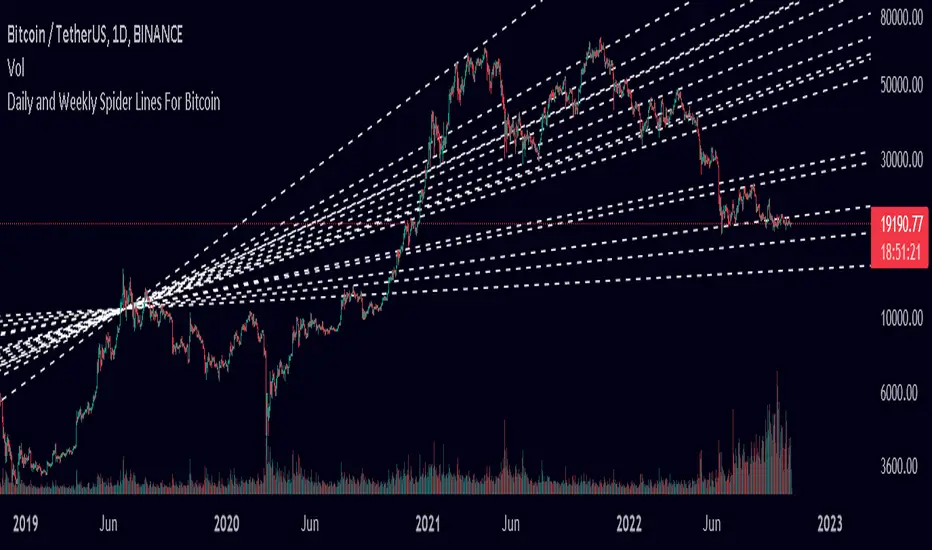
I haven't seen any indicator do this, so I decided to publish this to form automatic Spider Charts without actually going through the effort of drawing them!
This script charts dotted lines (spider lines) all over, depicting support and resistance levels.
It works by connecting some candles from the 2018 bear market to the candle from 1st July 2019, followed by extending the lines to the right, making support and resistance levels for the future. The script works only for the daily and weekly charts for Bitcoin.
The levels are accurate to a good extent.
If the lines don't load, zoom out until the 2018 bear market top and it should load then.
Have fun with this indicator!
סקריפט קוד פתוח
ברוח האמיתית של TradingView, יוצר הסקריפט הזה הפך אותו לקוד פתוח, כך שסוחרים יוכלו לעיין בו ולאמת את פעולתו. כל הכבוד למחבר! אמנם ניתן להשתמש בו בחינם, אך זכור כי פרסום חוזר של הקוד כפוף ל־כללי הבית שלנו.
כתב ויתור
המידע והפרסומים אינם מיועדים להיות, ואינם מהווים, ייעוץ או המלצה פיננסית, השקעתית, מסחרית או מכל סוג אחר המסופקת או מאושרת על ידי TradingView. קרא עוד ב־תנאי השימוש.