OPEN-SOURCE SCRIPT
TrendStrength Turbo Bars - Directional Trends
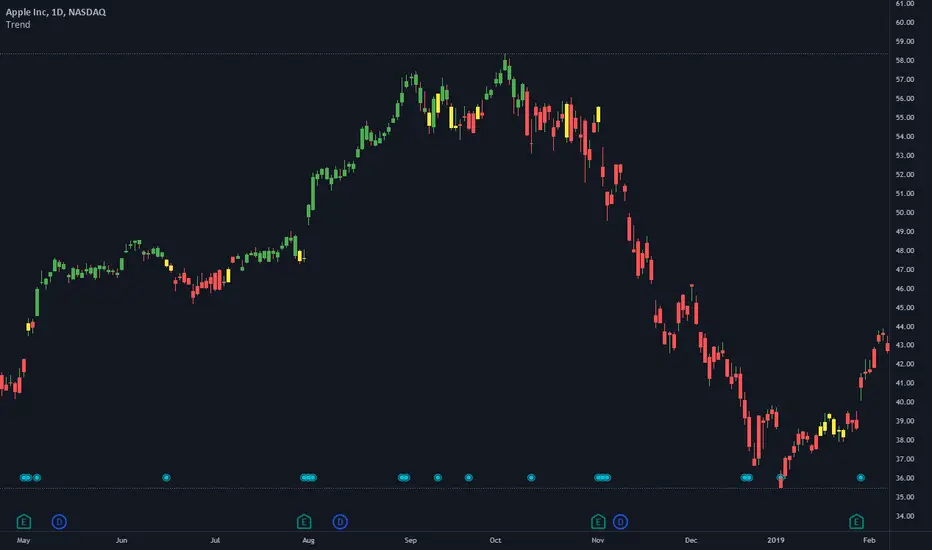
My interpretation of Danielle Shay's popular SimplerTrading TrendStrength Turbo indicator.
The TrendStrength indicator is based on a Fibonacci-based stacked EMA arrangement using the 5, 8, 13, 21 and 34 EMAs:
-> Green bars indicate an uptrend i.e. when the EMAs are positively stacked - there is more upward pressure than downward pressure in the price;
-> Red bars indicate a downtrend i.e. i.e. when the EMAs are negatively stacked - there is more downward pressure on the price; and
-> Yellow bars indicate no strong directional trend and potential for a reversal.
Volume spikes 50% above average volume are then flagged as dots at the bottom of the chart further confirming price momentum.
This indicator should compliment other popular indicators, as confirmation whether to stay in a position or not.
סקריפט קוד פתוח
ברוח האמיתית של TradingView, יוצר הסקריפט הזה הפך אותו לקוד פתוח, כך שסוחרים יוכלו לעיין בו ולאמת את פעולתו. כל הכבוד למחבר! אמנם ניתן להשתמש בו בחינם, אך זכור כי פרסום חוזר של הקוד כפוף ל־כללי הבית שלנו.
כתב ויתור
המידע והפרסומים אינם מיועדים להיות, ואינם מהווים, ייעוץ או המלצה פיננסית, השקעתית, מסחרית או מכל סוג אחר המסופקת או מאושרת על ידי TradingView. קרא עוד ב־תנאי השימוש.