OPEN-SOURCE SCRIPT
מעודכן RSI Momentum Trend

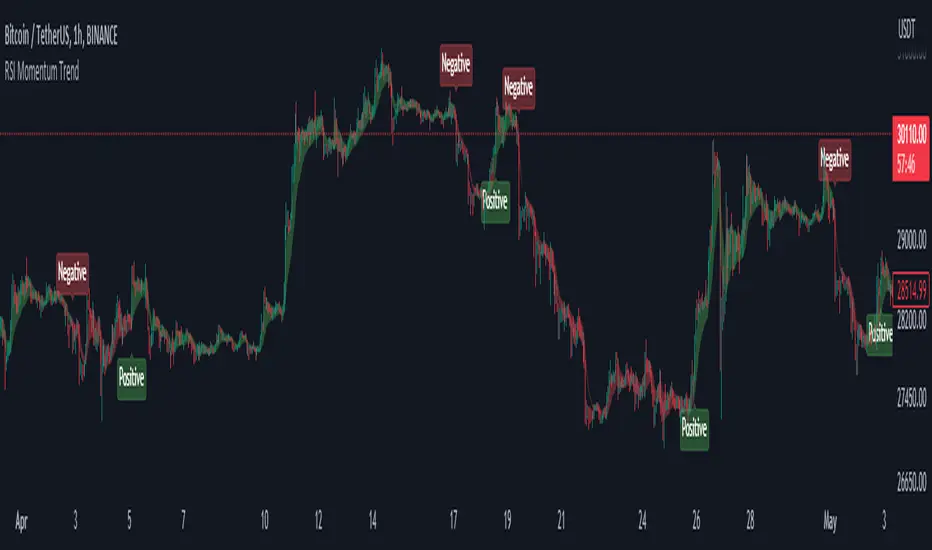
The "RSI Momentum Trend" indicator is a valuable tool for traders seeking to identify momentum trends.
By utilizing the Relative Strength Index (RSI) and customizable momentum thresholds, this indicator helps traders spot potential bullish and bearish signals.
you can adjust input parameters such as the RSI period, positive and negative momentum thresholds, and visual settings to align with their trading strategies.
The indicator calculates the RSI and evaluates two momentum conditions: positive and negative.
The positive condition considers the previous RSI value, current RSI value, and positive change in the 5-period exponential moving average (EMA) of the closing price.
The negative condition looks at the current RSI value and negative change in the 5-period EMA.
Once a momentum condition is met, the indicator visually represents the signal on the chart.
The "RSI Momentum Trend" indicator provides you with a quick and effective way to identify momentum trends using RSI calculations.
By incorporating visual cues and customizable parameters, it assists traders in making informed decisions about potential market movements.
הערות שחרור
Minor change סקריפט קוד פתוח
ברוח האמיתית של TradingView, יוצר הסקריפט הזה הפך אותו לקוד פתוח, כך שסוחרים יוכלו לעיין בו ולאמת את פעולתו. כל הכבוד למחבר! אמנם ניתן להשתמש בו בחינם, אך זכור כי פרסום חוזר של הקוד כפוף ל־כללי הבית שלנו.
Links : linktr.ee/tzacks
כתב ויתור
המידע והפרסומים אינם מיועדים להיות, ואינם מהווים, ייעוץ או המלצה פיננסית, השקעתית, מסחרית או מכל סוג אחר המסופקת או מאושרת על ידי TradingView. קרא עוד ב־תנאי השימוש.
סקריפט קוד פתוח
ברוח האמיתית של TradingView, יוצר הסקריפט הזה הפך אותו לקוד פתוח, כך שסוחרים יוכלו לעיין בו ולאמת את פעולתו. כל הכבוד למחבר! אמנם ניתן להשתמש בו בחינם, אך זכור כי פרסום חוזר של הקוד כפוף ל־כללי הבית שלנו.
Links : linktr.ee/tzacks
כתב ויתור
המידע והפרסומים אינם מיועדים להיות, ואינם מהווים, ייעוץ או המלצה פיננסית, השקעתית, מסחרית או מכל סוג אחר המסופקת או מאושרת על ידי TradingView. קרא עוד ב־תנאי השימוש.
