OPEN-SOURCE SCRIPT
מעודכן RaenonX - NQ 7 Dashboard

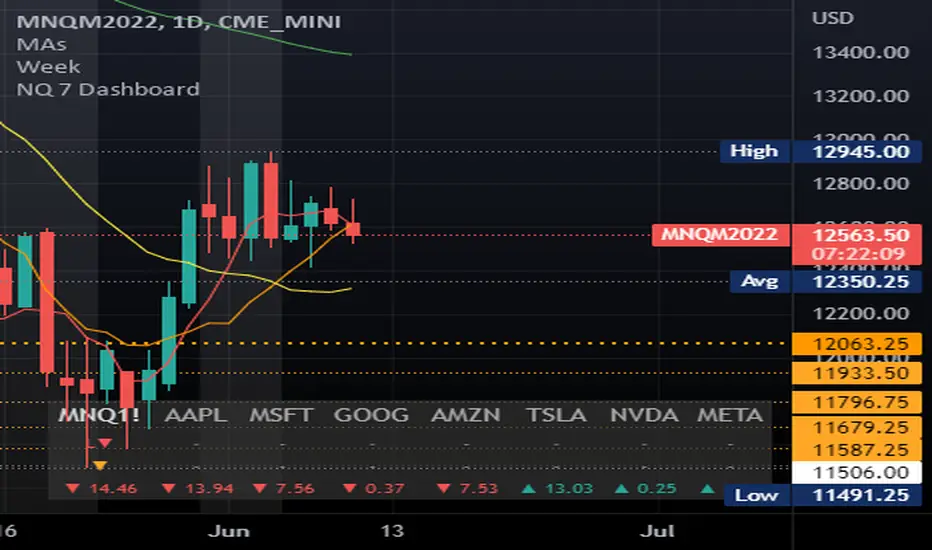
Places a table at the bottom right side showing the top 7 stocks (AAPL, MSFT, GOOG, AMZN, TSLA, NVDA, FB) current position for the given MA and daily position.
The 2nd row shows the current position related to the prior day open/high/low. There are 4 possible values:
The 3rd row shows the current position related to the given SMA parameters. The default period is 22 using 5 minutes timeframe. There are 4 possible values:
The 2nd row shows the current position related to the prior day open/high/low. There are 4 possible values:
- H+: Higher than the prior day high - indicates bullish in daily timeframe.
- O+: Higher than the prior day open - indicates pro-bullish consolidation in daily timeframe.
- L+: Higher than the prior day low - indicates pro-bearish consolidation in daily timeframe.
- L-: Lower than the prior day high - indicates bearish in daily timeframe.
The 3rd row shows the current position related to the given SMA parameters. The default period is 22 using 5 minutes timeframe. There are 4 possible values:
- B+: Higher than the SMA upper band - indicates bullish movement.
- +: Higher than the SMA - indicates pro-bullish movement, possibly consolidating.
- -: Lower than the SMA - indicates pro-bearish movement, possibly consolidating.
- B-: Lower than the SMA lower band - indicates bearish movement.
הערות שחרור
Updated band StDev input step.הערות שחרור
Updated symbols & disabled stock out of regular session regardless the settings. הערות שחרור
Added index influence value & Optimized performance.הערות שחרור
Hides main 7 stocks of NDX out of stock trading session (including pre-market and post-market).הערות שחרור
Replaced position buffering mechanism with Amplitude (was using the same mechanism of Bollinger Bands).הערות שחרור
Updated ticker from FB to META.סקריפט קוד פתוח
ברוח האמיתית של TradingView, יוצר הסקריפט הזה הפך אותו לקוד פתוח, כך שסוחרים יוכלו לעיין בו ולאמת את פעולתו. כל הכבוד למחבר! אמנם ניתן להשתמש בו בחינם, אך זכור כי פרסום חוזר של הקוד כפוף ל־כללי הבית שלנו.
כתב ויתור
המידע והפרסומים אינם מיועדים להיות, ואינם מהווים, ייעוץ או המלצה פיננסית, השקעתית, מסחרית או מכל סוג אחר המסופקת או מאושרת על ידי TradingView. קרא עוד ב־תנאי השימוש.
סקריפט קוד פתוח
ברוח האמיתית של TradingView, יוצר הסקריפט הזה הפך אותו לקוד פתוח, כך שסוחרים יוכלו לעיין בו ולאמת את פעולתו. כל הכבוד למחבר! אמנם ניתן להשתמש בו בחינם, אך זכור כי פרסום חוזר של הקוד כפוף ל־כללי הבית שלנו.
כתב ויתור
המידע והפרסומים אינם מיועדים להיות, ואינם מהווים, ייעוץ או המלצה פיננסית, השקעתית, מסחרית או מכל סוג אחר המסופקת או מאושרת על ידי TradingView. קרא עוד ב־תנאי השימוש.