OPEN-SOURCE SCRIPT
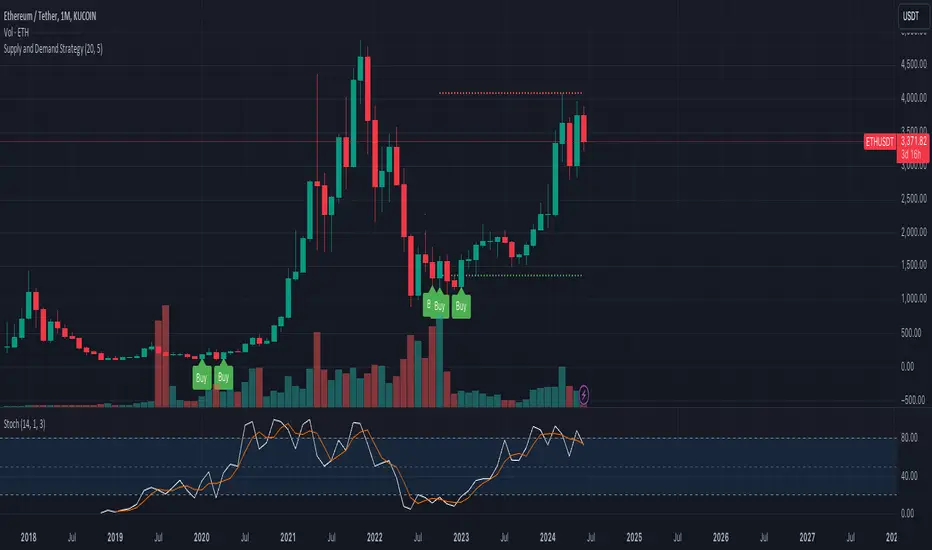
Supply and Demand Strategy

Overview
This strategy is designed to identify key supply (resistance) and demand (support) zones on a price chart. These zones represent areas where the price has historically shown a significant reaction, either bouncing up from a demand zone or dropping down from a supply zone. The strategy provides clear entry and exit points for trades based on these zones.
Key Components
Supply and Demand Zones:
Supply Zone: An area where the price has reversed from an uptrend to a downtrend. It represents a high concentration of sellers.
Demand Zone: An area where the price has reversed from a downtrend to an uptrend. It represents a high concentration of buyers.
Time Frames:
Use higher time frames (like daily or weekly) to identify key supply and demand zones.
Use lower time frames (like 1-hour or 4-hour) to pinpoint precise entry and exit points within these zones.
Confirmation:
Use price action and candlestick patterns (like pin bars or engulfing patterns) to confirm potential reversals in these zones.
סקריפט קוד פתוח
ברוח האמיתית של TradingView, יוצר הסקריפט הזה הפך אותו לקוד פתוח, כך שסוחרים יוכלו לעיין בו ולאמת את פעולתו. כל הכבוד למחבר! אמנם ניתן להשתמש בו בחינם, אך זכור כי פרסום חוזר של הקוד כפוף ל־כללי הבית שלנו.
כתב ויתור
המידע והפרסומים אינם מיועדים להיות, ואינם מהווים, ייעוץ או המלצה פיננסית, השקעתית, מסחרית או מכל סוג אחר המסופקת או מאושרת על ידי TradingView. קרא עוד ב־תנאי השימוש.