OPEN-SOURCE SCRIPT
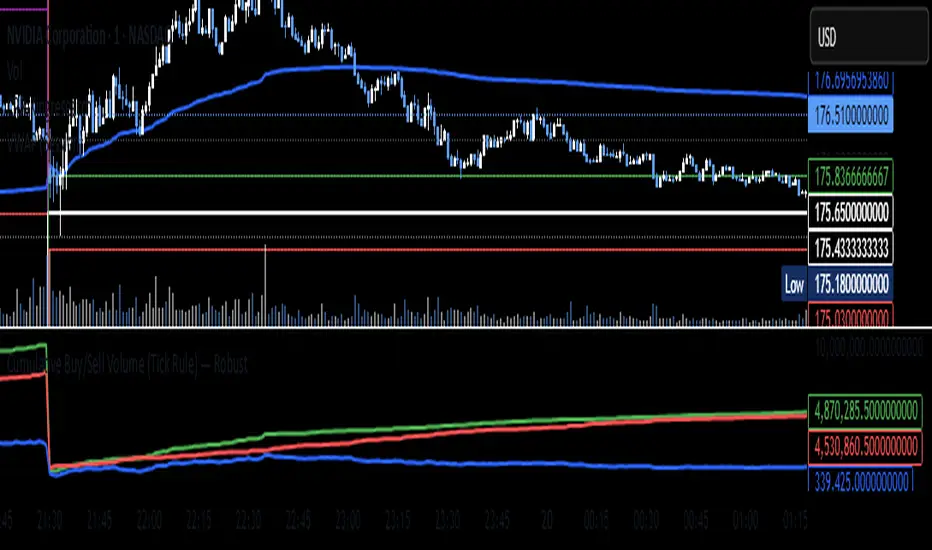
Cumulative Buy/Sell Volume (Tick Rule) — Robust
//version=5
indicator("Cumulative Buy/Sell Volume (Tick Rule) — Robust", overlay=false)
// ------- User inputs -------
resetDaily = input.bool(true, "Reset cumulative at new day/session")
showBarHist = input.bool(false, "Show per-bar buy/sell histogram")
useHalfOnEqual = input.bool(true, "Split volume 50/50 when price unchanged")
// ------- Safe previous close and volume -------
prevClose = nz(close[1], close) // avoid na on first bar
vol = float(volume)
// ------- Classification (Tick Rule approximation) -------
buyVol = close > prevClose ? vol : (close < prevClose ? 0.0 : (useHalfOnEqual ? vol * 0.5 : 0.0))
sellVol = close < prevClose ? vol : (close > prevClose ? 0.0 : (useHalfOnEqual ? vol * 0.5 : 0.0))
// ------- Cumulative totals (with optional daily reset) -------
var float cumBuy = 0.0
var float cumSell = 0.0
newDay = time("D") != time("D")[1]
if resetDaily and newDay
cumBuy := 0.0
cumSell := 0.0
cumBuy := cumBuy + buyVol
cumSell := cumSell + sellVol
cumDelta = cumBuy - cumSell
// ------- Plots -------
plot(cumBuy, title="Cumulative Buy Volume", color=color.green, linewidth=2)
plot(cumSell, title="Cumulative Sell Volume", color=color.red, linewidth=2)
plot(cumDelta, title="Cumulative Delta (Buy - Sell)", color=color.blue, linewidth=2)
// optional: per-bar histograms
plot(showBarHist ? buyVol : na, style=plot.style_columns, title="Bar Buy Vol", color=color.new(color.green, 60))
plot(showBarHist ? sellVol : na, style=plot.style_columns, title="Bar Sell Vol", color=color.new(color.red, 60))
סקריפט קוד פתוח
ברוח TradingView אמיתית, היוצר של הסקריפט הזה הפך אותו לקוד פתוח, כך שסוחרים יכולים לבדוק ולאמת את הפונקציונליות שלו. כל הכבוד למחבר! למרות שאתה יכול להשתמש בו בחינם, זכור שפרסום מחדש של הקוד כפוף לכללי הבית שלנו.
כתב ויתור
המידע והפרסומים אינם אמורים להיות, ואינם מהווים, עצות פיננסיות, השקעות, מסחר או סוגים אחרים של עצות או המלצות שסופקו או מאושרים על ידי TradingView. קרא עוד בתנאים וההגבלות.