OPEN-SOURCE SCRIPT
Alerts and symbols

what is "Alerts and symbols"?
It is an indicator that allows you to watch more trading pairs and add alarms to them.
what it does?
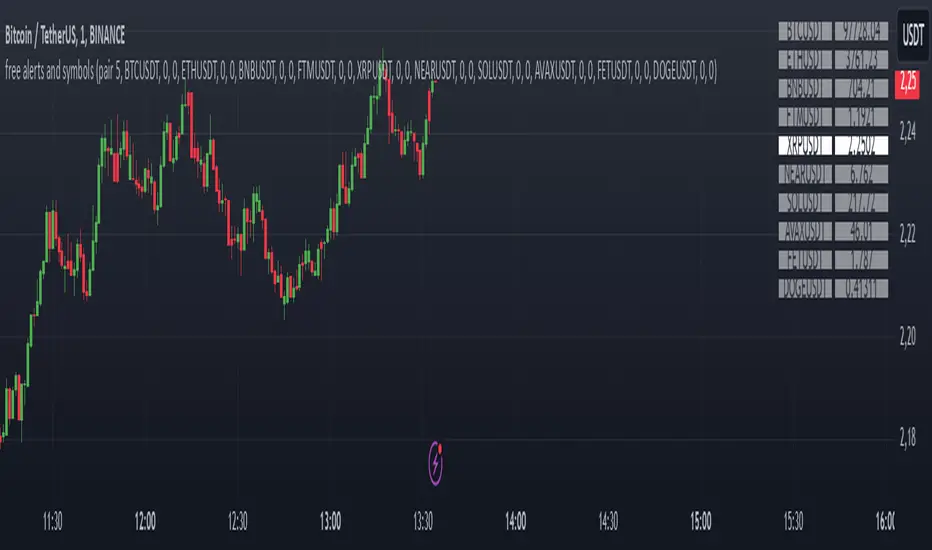
It allows you to set a total of 20 different intersection alarms, 2 in each pair, for 10 different trading pairs at the same time.
It draws the candlestick chart of a pair you choose among 10 trading pairs and the alarm lines you created for this trading pair on the chart.
It also allows you to see the prices of 10 different trading pairs at the same time, thanks to the table it creates.
how to use it?
First, select the alarm pairs you want to use, for example, BTCUSDT pair is the default value for "pair 1". You can choose 10 different trading pairs as you wish. Just below each trading pair, there are two different sections titled "line 1" and "line 2" so that you can set an alarm. Type here the price levels at which you want to be alerted in case of a price crossover.
You can use the "candle source" section to examine the candlestick charts of trading pairs. The indicator draws the candle chart of the trading pair selected in the "candle source" section.
Check the "show alert lines on chart" box to see the levels you have set an alarm for.
When everything is ready, first click on the three dots next to the indicator's name and then on the clock icon. then create an alarm and that's it.
סקריפט קוד פתוח
ברוח האמיתית של TradingView, יוצר הסקריפט הזה הפך אותו לקוד פתוח, כך שסוחרים יוכלו לעיין בו ולאמת את פעולתו. כל הכבוד למחבר! אמנם ניתן להשתמש בו בחינם, אך זכור כי פרסום חוזר של הקוד כפוף ל־כללי הבית שלנו.
כתב ויתור
המידע והפרסומים אינם מיועדים להיות, ואינם מהווים, ייעוץ או המלצה פיננסית, השקעתית, מסחרית או מכל סוג אחר המסופקת או מאושרת על ידי TradingView. קרא עוד ב־תנאי השימוש.