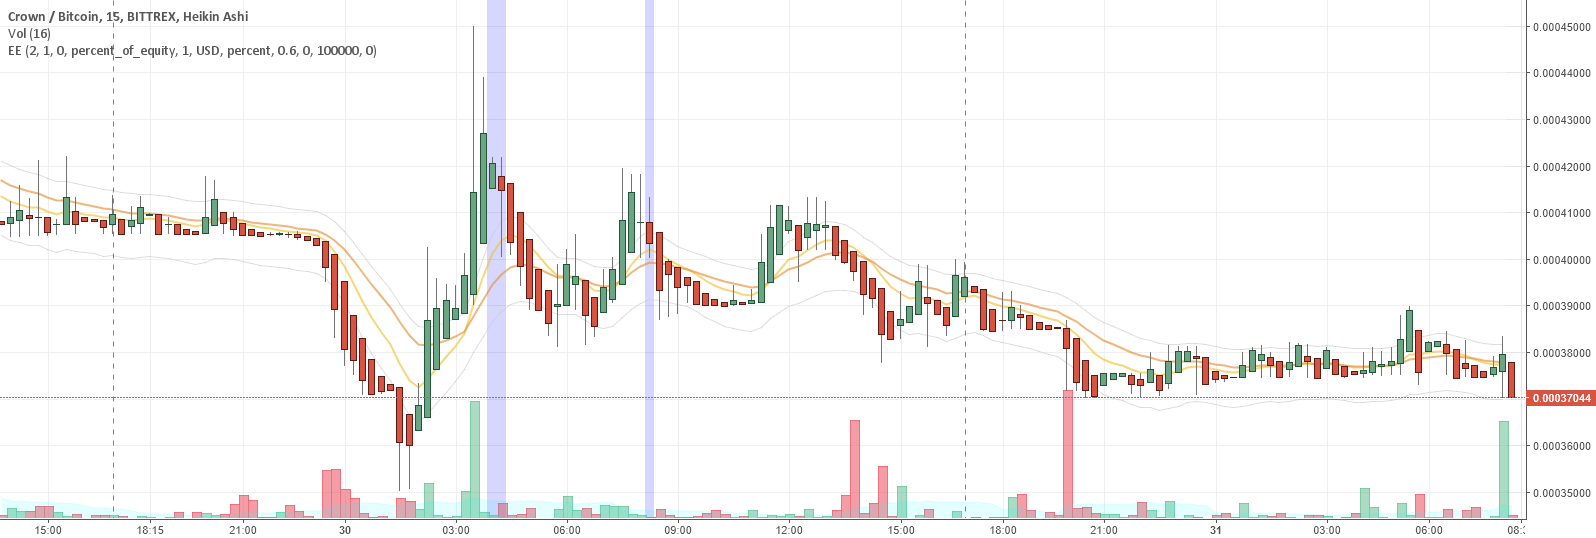
EMA Envelope Stepgain
This indicator shows a close approximation to what Gunbot would use in its GAIN and STEPGAIN strategies.
The middle two lines are the EMA(2h) and EMA(4h) lines. The inner two grey lines are BUYLVL2/SELLLVL2, the outer grey lines are just there to constrain the color bands. The green and red bands are indicators of where the candle has exceeded your setting and Gunbot would start considering buying or selling.
The middle two lines are the EMA(2h) and EMA(4h) lines. The inner two grey lines are BUYLVL2/SELLLVL2, the outer grey lines are just there to constrain the color bands. The green and red bands are indicators of where the candle has exceeded your setting and Gunbot would start considering buying or selling.
הערות שחרור:
Switch to using bgcolor which feels a little nicer to me. Also, using `na` as the default background will prevent a hidden white overlay.
הערות שחרור:
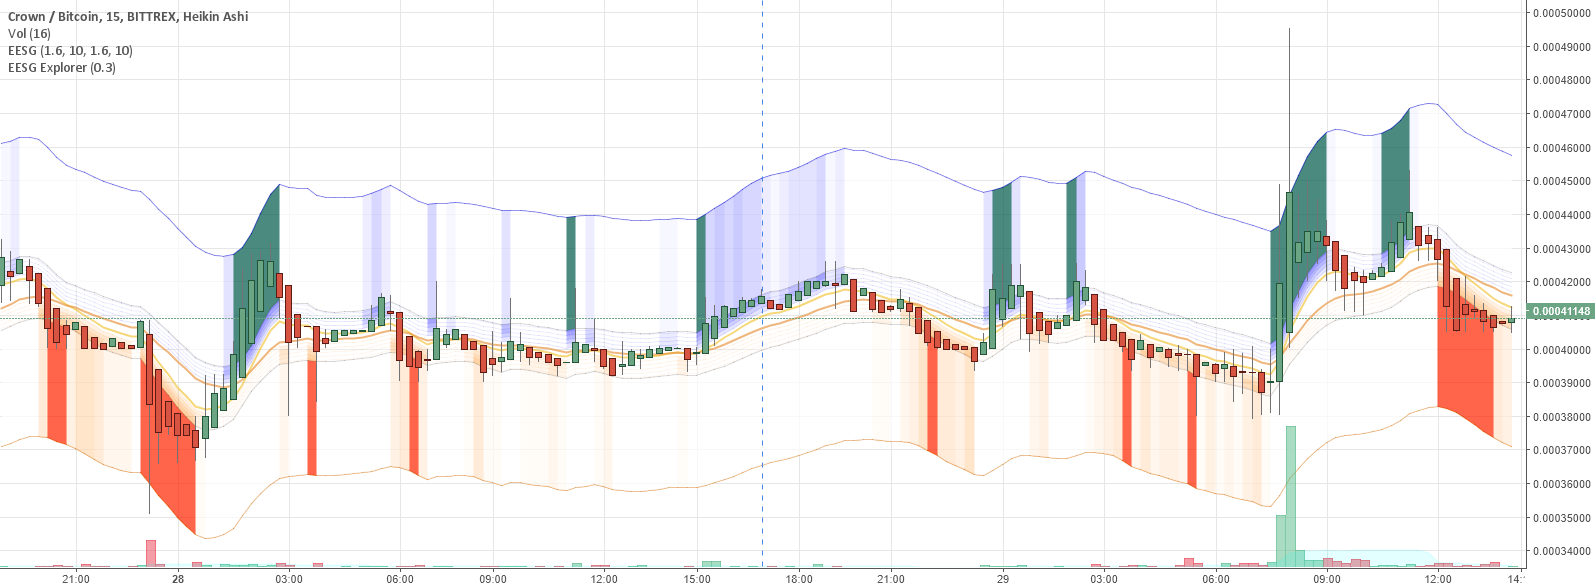
Set defaults that demonstrate the functionality better. Also, remove an extra indicator from the preview.
Part of a pack with:
EMA envelope:
 Stepgain simulator:
Stepgain explorer:
Bollinger bands explorer:
Stepgain simulator:
Stepgain explorer:
Bollinger bands explorer:
Part of a pack with:
EMA envelope: