Key Levels with RTH-Only Lines and End-of-Line Labels
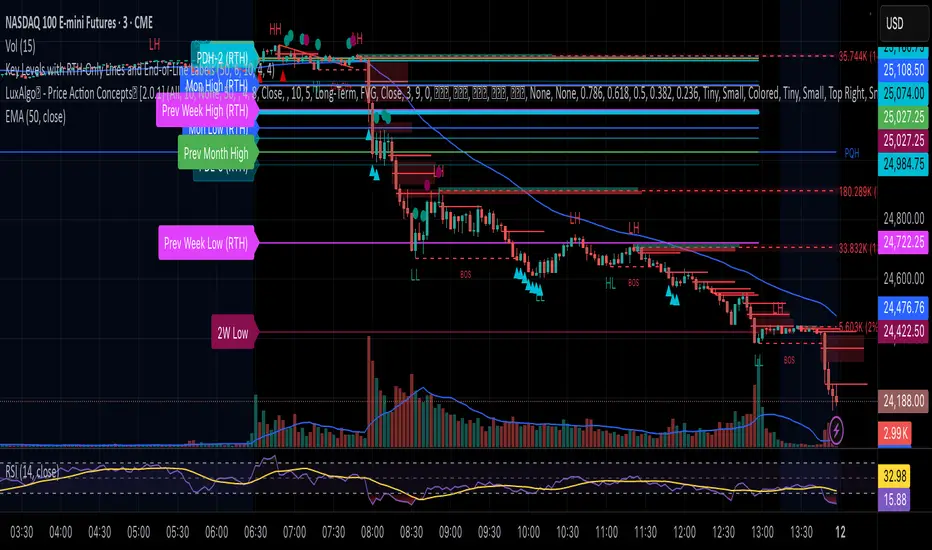
Each level is automatically updated based on session data and is visually extended across the current trading day using line breaks (plot.style_linebr). At the start of each RTH session, the script also places end-of-line labels identifying each level (e.g., PDH, PDL, Mon High, Mon Low, Weekly High/Low, Monthly High/Low), allowing traders to quickly reference key zones without clutter.
This tool is ideal for:
Futures and equity traders who rely on session-based support and resistance levels.
Identifying reaction points where liquidity often builds — such as prior highs/lows or weekly extremes.
Maintaining focus on live market structure while avoiding noise from premarket or overnight price action.
Additional features:
All levels and labels are plotted only during RTH for visual clarity.
Supports custom labeling and alert logic extensions for breakout or retest strategies.
Built with scalability in mind — works across different symbols and timeframes.
סקריפט להזמנה בלבד
רק משתמשים שאושרו על ידי המחבר יכולים לגשת לסקריפט הזה. יהיה עליך לשלוח בקשת גישה ולקבל אישור לשימוש. בדרך כלל, הגישה ניתנת לאחר תשלום. למידע נוסף, עקוב אחר ההוראות של היוצר בהמשך או צור קשר עם govind220 ישירות.
TradingView לא ממליצה לשלם עבור סקריפט או להשתמש בו אלא אם כן אתה סומך לחלוטין על המחבר שלו ומבין כיצד הוא פועל. ייתכן שתוכל גם למצוא חלופות חינמיות וקוד פתוח ב-סקריפטים הקהילתיים שלנו.
הוראות המחבר
כתב ויתור
סקריפט להזמנה בלבד
רק משתמשים שאושרו על ידי המחבר יכולים לגשת לסקריפט הזה. יהיה עליך לשלוח בקשת גישה ולקבל אישור לשימוש. בדרך כלל, הגישה ניתנת לאחר תשלום. למידע נוסף, עקוב אחר ההוראות של היוצר בהמשך או צור קשר עם govind220 ישירות.
TradingView לא ממליצה לשלם עבור סקריפט או להשתמש בו אלא אם כן אתה סומך לחלוטין על המחבר שלו ומבין כיצד הוא פועל. ייתכן שתוכל גם למצוא חלופות חינמיות וקוד פתוח ב-סקריפטים הקהילתיים שלנו.