OPEN-SOURCE SCRIPT
BTC top bottom weekly bands
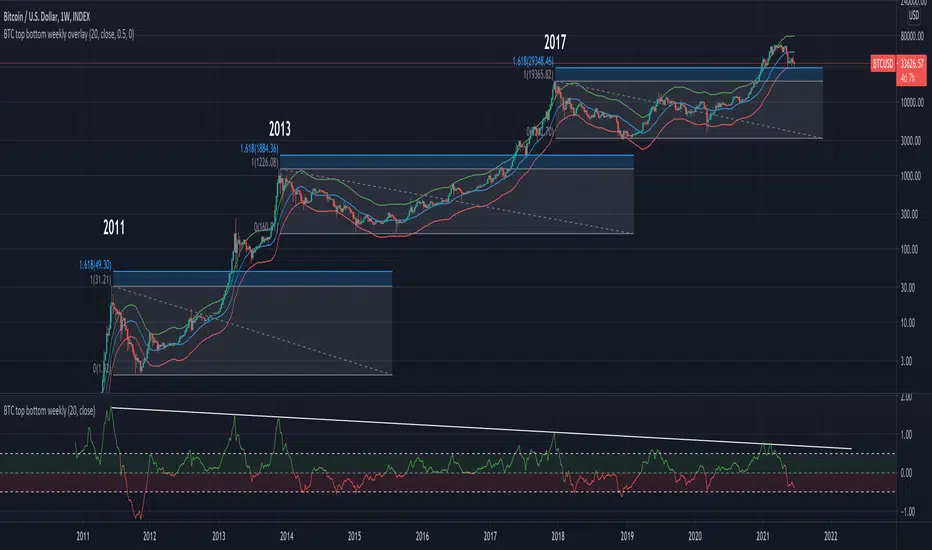
This indicator is based on the 20 weekly simple moving average and it could be used to help finding potential tops and bottoms on a weekly BTC chart.
When using the provided "coef" parameter set to the default of 0.5 it shows how most bottoms since 2013 have hit the lower band of this indicator.
The lower band is calculated as exp(coef) * sma(close)
Instructions:
- Use with the symbol INDEX:BTCUSD so you can see the price since 2010
- Set the timeframe to weekly
- Use logarithmic chart (toggle "log" on)
Optionals:
- change the coef to 0.6 for a more conservative bottom
- change the coef to 0.4 for a more conservative top
סקריפט קוד פתוח
ברוח האמיתית של TradingView, יוצר הסקריפט הזה הפך אותו לקוד פתוח, כך שסוחרים יוכלו לעיין בו ולאמת את פעולתו. כל הכבוד למחבר! אמנם ניתן להשתמש בו בחינם, אך זכור כי פרסום חוזר של הקוד כפוף ל־כללי הבית שלנו.
Join our membership to gain access to the private scripts.
patreon.com/c/thetradingparrot
patreon.com/c/thetradingparrot
כתב ויתור
המידע והפרסומים אינם מיועדים להיות, ואינם מהווים, ייעוץ או המלצה פיננסית, השקעתית, מסחרית או מכל סוג אחר המסופקת או מאושרת על ידי TradingView. קרא עוד ב־תנאי השימוש.