OPEN-SOURCE SCRIPT
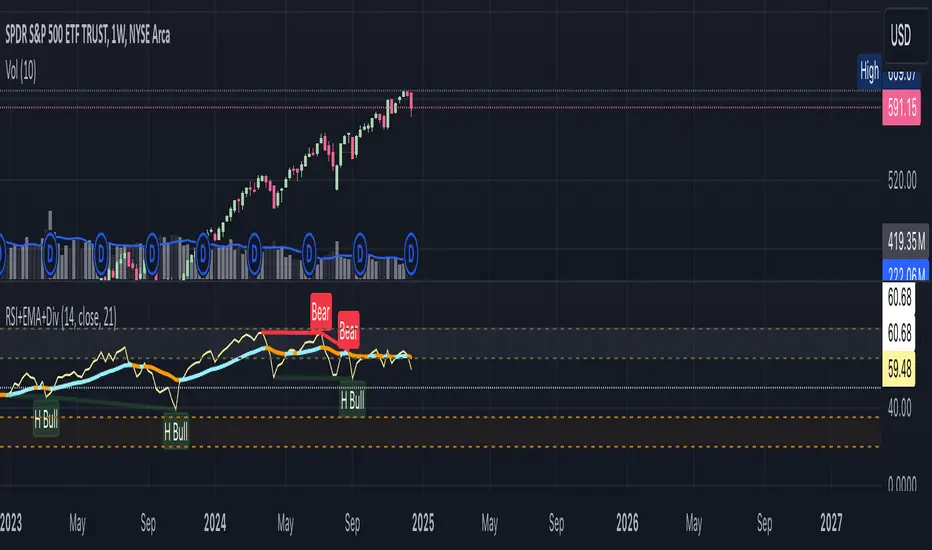
RSI+EMA+MZONES with Divergences

Features:
1. RSI Calculation:
2. EMA of RSI:
3. Bullish and Bearish Divergences:
4. Customizable Labels:
5. Alerts:
6. Fully Customizable:
How to Use:
1. RSI Calculation:
- Uses user-defined periods to calculate the RSI and visualize momentum shifts.
- Plots key RSI zones, including upper (overbought), lower (oversold), and middle levels.
2. EMA of RSI:
- Includes an Exponential Moving Average (EMA) of the RSI for trend smoothing and confirmation.
3. Bullish and Bearish Divergences:
- Detects Regular divergences (labeled as “Bull” and “Bear”) for classic signals.
- Identifies Hidden divergences (labeled as “H Bull” and “H Bear”) for potential trend continuation opportunities.
4. Customizable Labels:
- Displays divergence labels directly on the chart.
- Labels can be toggled on or off for better chart visibility.
5. Alerts:
- Predefined alerts for both regular and hidden divergences to notify users in real time.
6. Fully Customizable:
- Adjust RSI period, lookback settings, divergence ranges, and visibility preferences.
- Colors and styles are easily configurable to match your trading style.
How to Use:
- RSI Zones: Use RSI and its zones to identify overbought/oversold conditions.
- EMA: Look for crossovers or confluence with divergences for confirmation.
- Divergences: Monitor for “Bull,” “Bear,” “H Bull,” or “H Bear” labels to spot key reversal or continuation signals.
- Alerts: Set alerts to be notified of divergence opportunities without constant chart monitoring.
סקריפט קוד פתוח
ברוח האמיתית של TradingView, יוצר הסקריפט הזה הפך אותו לקוד פתוח, כך שסוחרים יוכלו לעיין בו ולאמת את פעולתו. כל הכבוד למחבר! אמנם ניתן להשתמש בו בחינם, אך זכור כי פרסום חוזר של הקוד כפוף ל־כללי הבית שלנו.
כתב ויתור
המידע והפרסומים אינם מיועדים להיות, ואינם מהווים, ייעוץ או המלצה פיננסית, השקעתית, מסחרית או מכל סוג אחר המסופקת או מאושרת על ידי TradingView. קרא עוד ב־תנאי השימוש.