PROTECTED SOURCE SCRIPT
מעודכן Anchored OBV RSI: "V-RSI"
About the Indicator:
V-RSI uses values from the traditional "Relative Strength Index(RSI)" oscillator and the "On Balance Volume(OBV)" indicator and anchors them into an oscillator format. In doing so, we are given a more concrete overview of volume/sentiment data relative to the RSI for analysis of trend strength and decision making.
EXTRAS: BTC MODE => for BTC only.
In BTC MODE, the indicator uses BTC volume data from the following 5 major exchanges: BINANCE, COINBASE, FTX, BITMEX, BITFINEX.
The sum of this data is taken to depict anchored OBV values. This allows for a more accurate representation of Global Volume.
How to use it
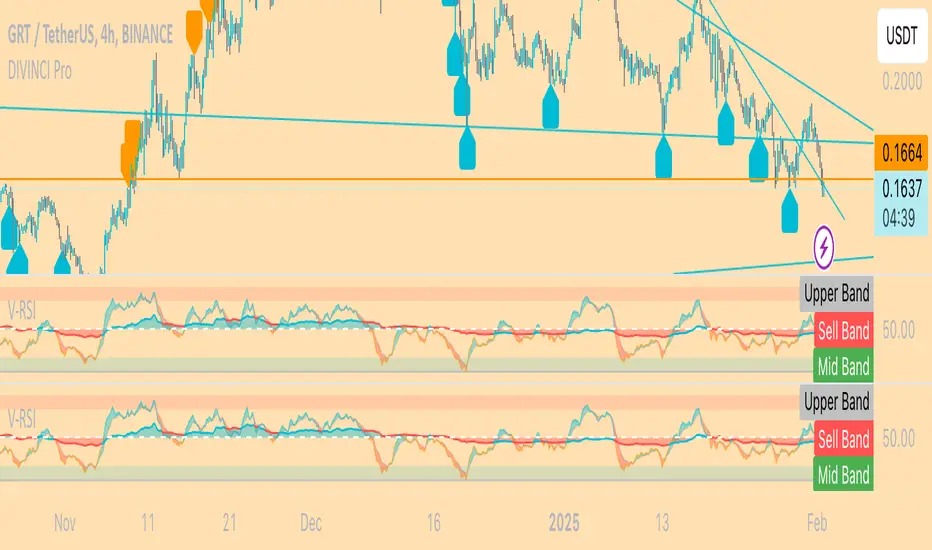
The indicator can be used like the normal RSI with the OBV (area in the middle) showing volume sentiment.
<50 is seen as bearish
>50 is seen as bullish
Using this data, it becomes easier to identify unsustainable trends, reversals, divergences
An example of an unsustainable trend and reversal would be if RSI values are overbought ( RSI > 70) yet OBV oscillator remains below 50.
== chances of unsustainable trend reversal are more likely.
For more questions, send me a message here on Tradingview.
Happy trading,
MM :)
V-RSI uses values from the traditional "Relative Strength Index(RSI)" oscillator and the "On Balance Volume(OBV)" indicator and anchors them into an oscillator format. In doing so, we are given a more concrete overview of volume/sentiment data relative to the RSI for analysis of trend strength and decision making.
EXTRAS: BTC MODE => for BTC only.
In BTC MODE, the indicator uses BTC volume data from the following 5 major exchanges: BINANCE, COINBASE, FTX, BITMEX, BITFINEX.
The sum of this data is taken to depict anchored OBV values. This allows for a more accurate representation of Global Volume.
How to use it
The indicator can be used like the normal RSI with the OBV (area in the middle) showing volume sentiment.
<50 is seen as bearish
>50 is seen as bullish
Using this data, it becomes easier to identify unsustainable trends, reversals, divergences
An example of an unsustainable trend and reversal would be if RSI values are overbought ( RSI > 70) yet OBV oscillator remains below 50.
== chances of unsustainable trend reversal are more likely.
For more questions, send me a message here on Tradingview.
Happy trading,
MM :)
הערות שחרור
BTC MODE off by default now. Turn it on when trading btc.הערות שחרור
Added Bybit to ObV dataסקריפט מוגן
סקריפט זה פורסם כמקור סגור. עם זאת, תוכל להשתמש בו בחופשיות וללא כל מגבלות – למד עוד כאן
כתב ויתור
המידע והפרסומים אינם מיועדים להיות, ואינם מהווים, ייעוץ או המלצה פיננסית, השקעתית, מסחרית או מכל סוג אחר המסופקת או מאושרת על ידי TradingView. קרא עוד ב־תנאי השימוש.
סקריפט מוגן
סקריפט זה פורסם כמקור סגור. עם זאת, תוכל להשתמש בו בחופשיות וללא כל מגבלות – למד עוד כאן
כתב ויתור
המידע והפרסומים אינם מיועדים להיות, ואינם מהווים, ייעוץ או המלצה פיננסית, השקעתית, מסחרית או מכל סוג אחר המסופקת או מאושרת על ידי TradingView. קרא עוד ב־תנאי השימוש.