OPEN-SOURCE SCRIPT
Sigma Score
Function and Purpose
The Sigma Score indicator is a tool for analyzing volatility and identifying unusual price movements of a financial instrument over a specified timeframe. It calculates the "Sigma Score," which measures how far the current price change deviates from its historical average in terms of standard deviations. This helps identify potential extremes and unusual market conditions.
Features
Sigma Score Calculation
Visual Representation
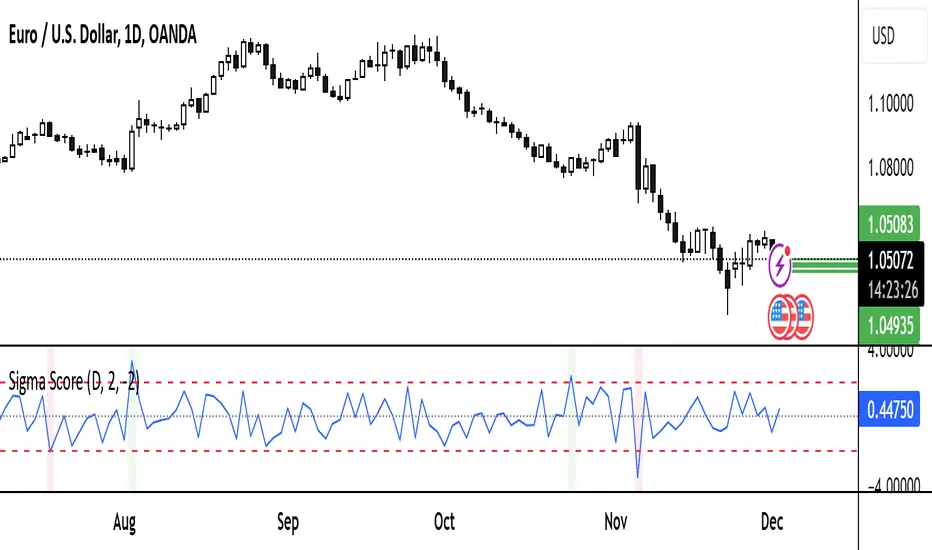
Sigma Score Plot: The Sigma Score is displayed as a line.
Horizontal Threshold Lines:
Background Highlighting:
Custom Settings
Use Cases
Notes and Limitations
Summary
The Sigma Score indicator is a powerful tool for traders and analysts to quickly identify unusual market conditions and make informed decisions. Its flexibility in adjusting timeframes and thresholds makes it a versatile addition to any trading strategy.
The Sigma Score indicator is a tool for analyzing volatility and identifying unusual price movements of a financial instrument over a specified timeframe. It calculates the "Sigma Score," which measures how far the current price change deviates from its historical average in terms of standard deviations. This helps identify potential extremes and unusual market conditions.
Features
- Timeframe Control
- Users can select the desired timeframe for analysis (e.g., minutes, hours, days). This makes the indicator adaptable to various trading styles:
- Supported timeframes: Minutes (M1, M5, M10, M15), Hours (H1, H4, H12), Days (D), Weeks (W), Months (M).
Sigma Score Calculation
- The indicator computes the logarithmic return between consecutive price values.
- It calculates a simple moving average (SMA) and the standard deviation (StDev) of these returns.
- The Sigma Score is derived as the difference between the current return and the average, divided by the standard deviation.
Visual Representation
Sigma Score Plot: The Sigma Score is displayed as a line.
Horizontal Threshold Lines:
- A middle line (0) for reference.
- Upper and lower threshold lines (default: 2.0 and -2.0) for highlighting extremes.
Background Highlighting:
- Green for values above the upper threshold (positive deviations).
- Red for values below the lower threshold (negative deviations).
Custom Settings
- Timeframe
- Select the timeframe for analysis using a dropdown menu (default: D for daily).
- Thresholds
- Upper Threshold: Default = 2.0 (positive extreme area).
- Lower Threshold: Default = -2.0 (negative extreme area).
- Both values can be adjusted to modify the indicator's sensitivity.
Use Cases
- Identifying Extremes: Values above or below the thresholds can signal unusual market conditions, such as overbought or oversold areas.
- Analyzing Market Anomalies: The Sigma Score quantifies how unusual a price movement is based on historical data.
- Visual Aid: Threshold lines and background highlighting simplify the interpretation of boundary conditions.
Notes and Limitations
- Timeframe Dependency: Results may vary depending on the selected timeframe. Shorter timeframes highlight short-term movements, while longer timeframes capture broader trends.
- Volatility Sensitivity: The indicator is sensitive to changes in market volatility. Sudden price swings may produce extreme Sigma values.
Summary
The Sigma Score indicator is a powerful tool for traders and analysts to quickly identify unusual market conditions and make informed decisions. Its flexibility in adjusting timeframes and thresholds makes it a versatile addition to any trading strategy.
סקריפט קוד פתוח
ברוח האמיתית של TradingView, יוצר הסקריפט הזה הפך אותו לקוד פתוח, כך שסוחרים יוכלו לעיין בו ולאמת את פעולתו. כל הכבוד למחבר! אמנם ניתן להשתמש בו בחינם, אך זכור כי פרסום חוזר של הקוד כפוף ל־כללי הבית שלנו.
כתב ויתור
המידע והפרסומים אינם מיועדים להיות, ואינם מהווים, ייעוץ או המלצה פיננסית, השקעתית, מסחרית או מכל סוג אחר המסופקת או מאושרת על ידי TradingView. קרא עוד ב־תנאי השימוש.