OPEN-SOURCE SCRIPT
Trendilo (OPEN-SOURCE)
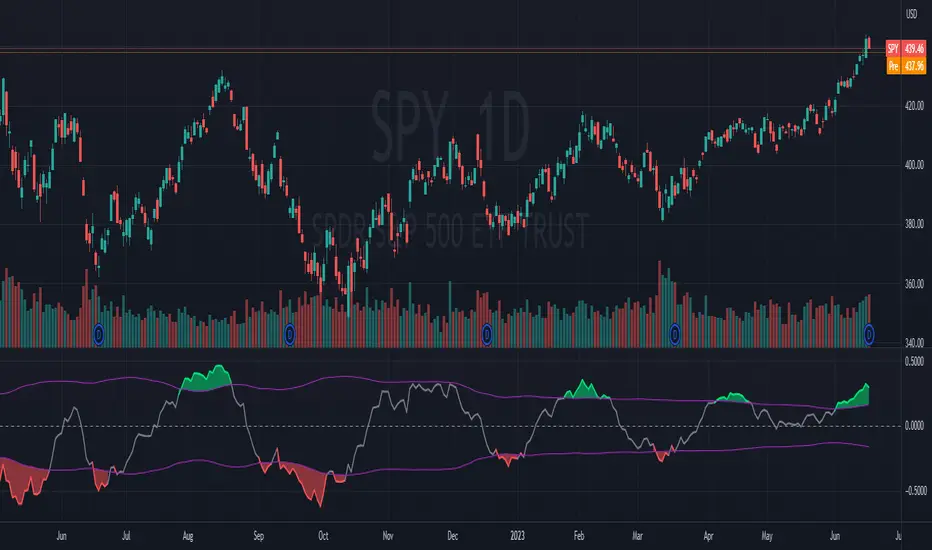
The provided code is a custom indicator called "Trendilo" in TradingView. It helps traders identify trends in price data. The indicator calculates the percentage change of the chosen price source and applies smoothing to it. Then, it calculates the Arnaud Legoux Moving Average (ALMA) of the smoothed percentage change. The ALMA is compared to a root mean square (RMS) band, which represents the expected range of the ALMA values. Based on this comparison, the indicator determines whether the trend is up, down, or sideways. The indicator line is plotted in a color corresponding to the trend direction. The indicator also provides the option to fill the area between the indicator line and the RMS band. Additionally, users can choose to color the bars of the chart based on the trend direction. Overall, the "Trendilo" indicator helps traders visually identify trends and potential reversals in the price data.
סקריפט קוד פתוח
ברוח האמיתית של TradingView, יוצר הסקריפט הזה הפך אותו לקוד פתוח, כך שסוחרים יוכלו לעיין בו ולאמת את פעולתו. כל הכבוד למחבר! אמנם ניתן להשתמש בו בחינם, אך זכור כי פרסום חוזר של הקוד כפוף ל־כללי הבית שלנו.
כתב ויתור
המידע והפרסומים אינם מיועדים להיות, ואינם מהווים, ייעוץ או המלצה פיננסית, השקעתית, מסחרית או מכל סוג אחר המסופקת או מאושרת על ידי TradingView. קרא עוד ב־תנאי השימוש.