PROTECTED SOURCE SCRIPT
Snapfront Market Clarity Index (MCI) — Lite
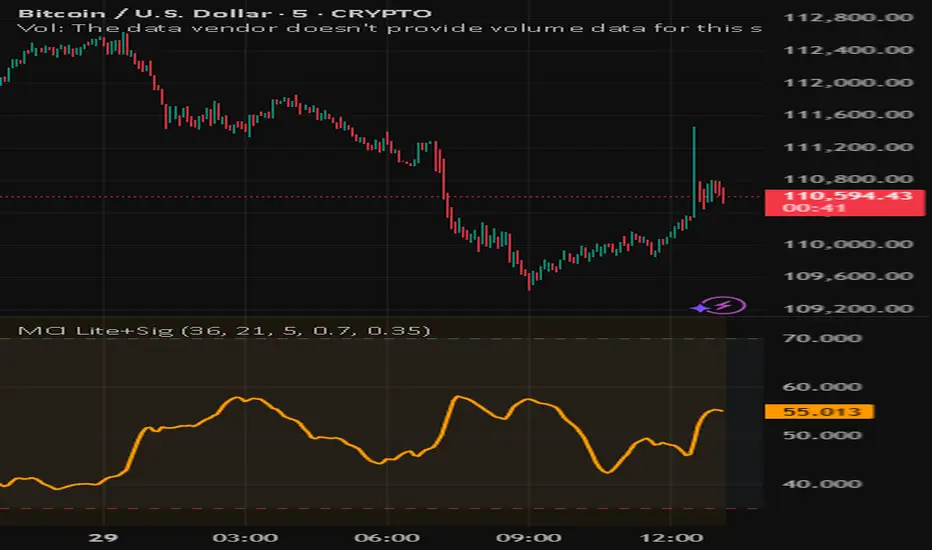
Market Clarity Index (MCI) — Lite + Signals
The Market Clarity Index (MCI) measures trend clarity vs. noise using returns, drift, and volume shock dynamics. Values are normalized through a φ²-based sigmoid for smooth, interpretable signals.
Features:
Clear 0–100 scale (Lite version)
Heatmap background for clarity regimes
Bull/Bear signal arrows with EMA filter
High/Low threshold lines for easy context
Trading Logic:
✅ Bull signal when MCI crosses into the high zone with price above EMA
❌ Bear signal when MCI crosses into the low zone with price below EMA
Use MCI as a trend filter, entry trigger, or market condition gauge across any timeframe or asset.
סקריפט מוגן
סקריפט זה פורסם כמקור סגור. עם זאת, תוכל להשתמש בו בחופשיות וללא כל מגבלות – למד עוד כאן
כתב ויתור
המידע והפרסומים אינם מיועדים להיות, ואינם מהווים, ייעוץ או המלצה פיננסית, השקעתית, מסחרית או מכל סוג אחר המסופקת או מאושרת על ידי TradingView. קרא עוד ב־תנאי השימוש.
סקריפט מוגן
סקריפט זה פורסם כמקור סגור. עם זאת, תוכל להשתמש בו בחופשיות וללא כל מגבלות – למד עוד כאן
כתב ויתור
המידע והפרסומים אינם מיועדים להיות, ואינם מהווים, ייעוץ או המלצה פיננסית, השקעתית, מסחרית או מכל סוג אחר המסופקת או מאושרת על ידי TradingView. קרא עוד ב־תנאי השימוש.