OPEN-SOURCE SCRIPT
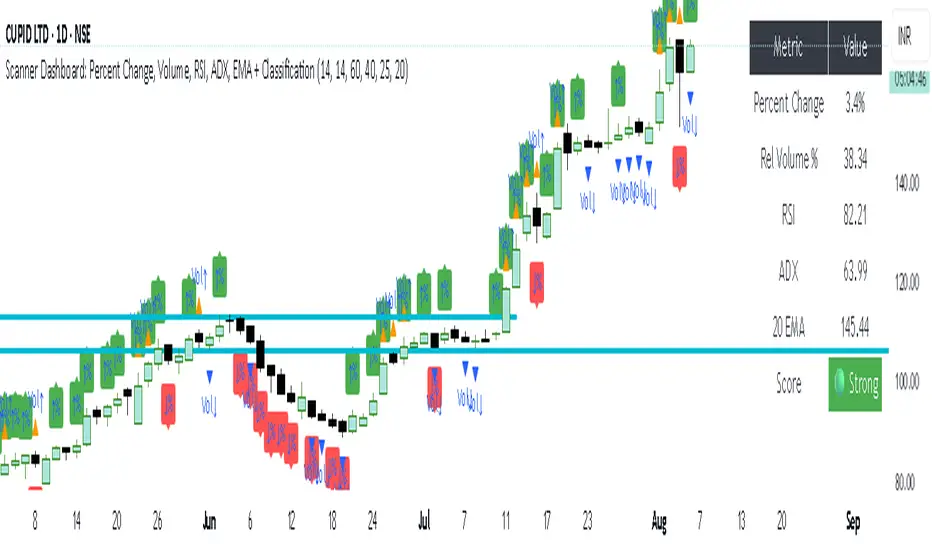
simple trend Scanner Dashboard

Script Does
- Calculates key metrics:
- Percent Change from previous day
- Relative Volume (% vs 10-bar average)
- RSI and ADX for strength/trend
- 20 EMA for dynamic support/resistance
- Classifies market condition:
- 🟢 Strong if RSI > 60 and ADX > 25
- 🔴 Weak if RSI < 40 and ADX < 20
- ⚪ Neutral otherwise
- Displays a table dashboard:
- Compact, color-coded summary of all metrics
- Easy to scan visually
- Plots visual signals:
- Arrows and triangles for percent change and volume spikes
- Data window plots for deeper inspection
סקריפט קוד פתוח
ברוח האמיתית של TradingView, יוצר הסקריפט הזה הפך אותו לקוד פתוח, כך שסוחרים יוכלו לעיין בו ולאמת את פעולתו. כל הכבוד למחבר! אמנם ניתן להשתמש בו בחינם, אך זכור כי פרסום חוזר של הקוד כפוף ל־כללי הבית שלנו.
כתב ויתור
המידע והפרסומים אינם מיועדים להיות, ואינם מהווים, ייעוץ או המלצה פיננסית, השקעתית, מסחרית או מכל סוג אחר המסופקת או מאושרת על ידי TradingView. קרא עוד ב־תנאי השימוש.