OPEN-SOURCE SCRIPT
Trident Finder
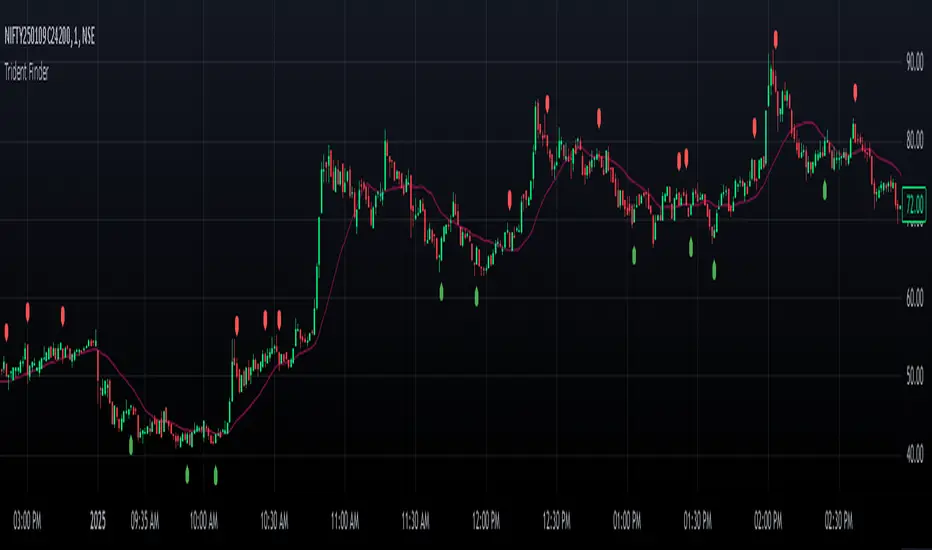
Introduction to the Trident Finder
The Trident Finder is a Pine Script indicator that identifies unique bullish and bearish patterns called Tridents. These patterns are based on specific relationships between consecutive candles, combined with a simple moving average (SMA) filter for added precision. By spotting these patterns, traders can potentially identify high-probability reversal points or trend continuations.
Core Logic
The indicator identifies two patterns:
Bullish Trident
A bullish Trident forms when:
Candle[2] (two candles back) has its High-Low range entirely above Candle[1] (the preceding candle).
Candle[0] (the current candle) has its Open-High-Low-Close (OHLC) above the Low of Candle[1].
Candle[0] closes higher than it opens and higher than Candle[1]’s close.
Candle[0] closes below the SMA, indicating a potential upward breakout against the trend.
Bearish Trident
A bearish Trident forms when:
Candle[2] has its High-Low range entirely below Candle[1].
Candle[0] has its OHLC below the High of Candle[1].
Candle[0] closes lower than it opens and lower than Candle[1]’s close.
Candle[0] closes above the SMA, indicating a potential downward breakout against the trend.
Visual Representation
Bullish Tridents are marked with green "Up" labels below the candle.
Bearish Tridents are marked with red "Down" labels above the candle.
The SMA is plotted as a maroon line to serve as a filter for the Trident patterns.
סקריפט קוד פתוח
ברוח האמיתית של TradingView, יוצר הסקריפט הזה הפך אותו לקוד פתוח, כך שסוחרים יוכלו לעיין בו ולאמת את פעולתו. כל הכבוד למחבר! אמנם ניתן להשתמש בו בחינם, אך זכור כי פרסום חוזר של הקוד כפוף ל־כללי הבית שלנו.
כתב ויתור
המידע והפרסומים אינם מיועדים להיות, ואינם מהווים, ייעוץ או המלצה פיננסית, השקעתית, מסחרית או מכל סוג אחר המסופקת או מאושרת על ידי TradingView. קרא עוד ב־תנאי השימוש.