OPEN-SOURCE SCRIPT
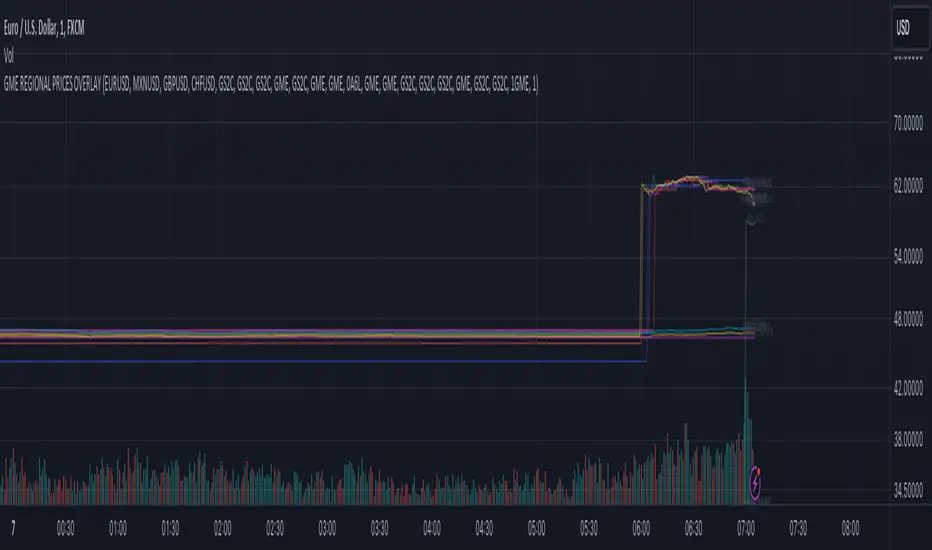
מעודכן GME REGIONAL PRICES OVERLAY

GME Regional Prices Overlay (VWAP)
1. Select a chart 24-hour ticker like FX_IDC:USDEUR
2. Select a timescale (5 min, 15 min, ...)
3. Monitor the regional price variance
Exchanges included: NYSE, XETR, BMV, FWB, SWB, BITTREX, FTX, LSE, CAPITALCOM (CFD)
Currency conversion: FX_IDC
1. Select a chart 24-hour ticker like FX_IDC:USDEUR
2. Select a timescale (5 min, 15 min, ...)
3. Monitor the regional price variance
Exchanges included: NYSE, XETR, BMV, FWB, SWB, BITTREX, FTX, LSE, CAPITALCOM (CFD)
Currency conversion: FX_IDC
הערות שחרור
GME Regional Prices Overlay1. Select a chart with around the clock ticker like FX_IDC:USDEUR
2. Select a timescale (5 min, 15 min, ...)
3. Monitor the regional price variance
Exchanges included: NYSE, XETR, BMV, FWB, SWB, MUN, PYTH, LSE, CAPITALCOM (CFD), BIVA
Currency conversion: FX_IDC
הערות שחרור
1. Select a chart with around the clock ticker like FX_IDC:USDEUR2. Select a timescale (5 min, 15 min, ...)
3. Drag the vertical price bar so that the graphs are visible
4. Monitor the regional price variance.
5. Large variance implies volatility in the short time frame (hours)
Exchanges included: NYSE, XETR, BMV, FWB, SWB, MUN, PYTH, LSE, CAPITALCOM (CFD), BIVA, BER, HAM, DUS, VIE, BX, TRADEGATE
Currency conversion: FX_IDC
הערות שחרור
1. Select a chart with around the clock ticker like FX_IDC:USDEUR2. Select a timescale (5 min, 15 min, ...)
3. Drag the screen up so the graphs are visible
Exchanges included: NYSE, XETR, BMV, FWB, SWB, MUN, PYTH, LSE, CAPITALCOM (CFD), BIVA, BER, HAM, DUS, VIE, BX, TRADEGATE
Currency conversion: FX_IDC
הערות שחרור
Updated labelsהערות שחרור
1. Select a chart with around the clock ticker like FX_IDC:USDEUR2. Select a timescale (5 min, 15 min, ...)
3. Drag the screen up so the graphs are visible
4. Monitor the regional price variance.
5. Large variance implies volatility in the short time frame (hours)
Exchanges included: NYSE, XETR, BMV, FWB, SWB, MUN, PYTH, LSIN,
CAPITALCOM (CFD), BIVA, BER, HAM, DUS, VIE,
BX, TRADEGATE, MIL
Currency conversion: FX_IDC
הערות שחרור
1. Select a chart with around the clock ticker like FX_IDC:USDEUR2. Select a timescale (5 min, 15 min, ...)
3. Drag the screen up so the graphs are visible
4. Monitor the regional price variance.
5. Large variance implies volatility in the short time frame (hours)
Exchanges included: NYSE, XETR, BMV, FWB, SWB, MUN, PYTH, LSIN,
CAPITALCOM (CFD), BIVA, BER, HAM, DUS, VIE,
BX, TRADEGATE, MIL
Currency conversion: FX_IDC
סקריפט קוד פתוח
ברוח האמיתית של TradingView, יוצר הסקריפט הזה הפך אותו לקוד פתוח, כך שסוחרים יוכלו לעיין בו ולאמת את פעולתו. כל הכבוד למחבר! אמנם ניתן להשתמש בו בחינם, אך זכור כי פרסום חוזר של הקוד כפוף ל־כללי הבית שלנו.
כתב ויתור
המידע והפרסומים אינם מיועדים להיות, ואינם מהווים, ייעוץ או המלצה פיננסית, השקעתית, מסחרית או מכל סוג אחר המסופקת או מאושרת על ידי TradingView. קרא עוד ב־תנאי השימוש.