PROTECTED SOURCE SCRIPT
Trend RSI
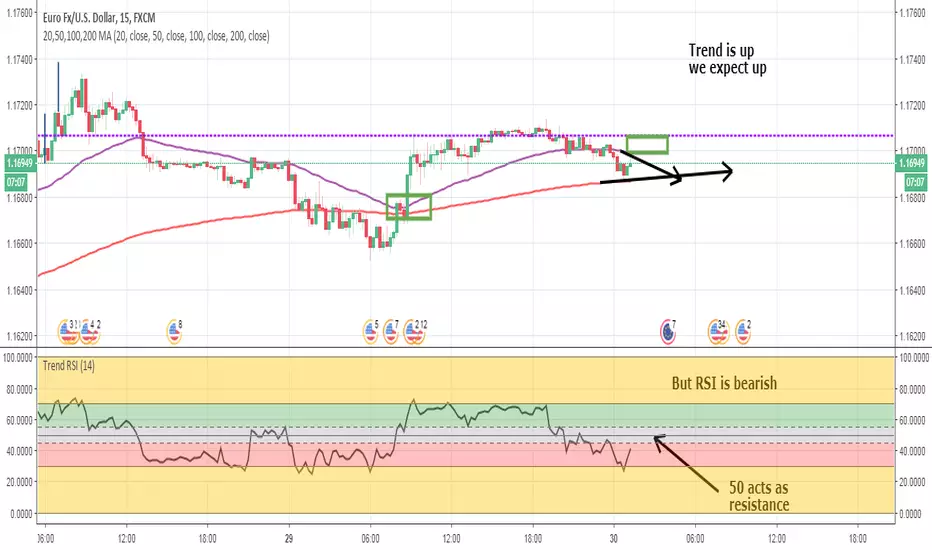
This version of RSI shows the proper levels of how to trade price action.
RSI is more than a reversal tool. It is also a trend following tool.
I've added bands to show Overbought/Oversold.
Above 55 is bullish. Below 45 is bearish.
Do not make any transactions in the 45-55 gray band area.
Coupled with a 50/200 EMA strategy this is more than enough to make a living at trading.
סקריפט מוגן
סקריפט זה פורסם כמקור סגור. עם זאת, תוכל להשתמש בו בחופשיות וללא כל מגבלות – למד עוד כאן
כתב ויתור
המידע והפרסומים אינם מיועדים להיות, ואינם מהווים, ייעוץ או המלצה פיננסית, השקעתית, מסחרית או מכל סוג אחר המסופקת או מאושרת על ידי TradingView. קרא עוד ב־תנאי השימוש.
סקריפט מוגן
סקריפט זה פורסם כמקור סגור. עם זאת, תוכל להשתמש בו בחופשיות וללא כל מגבלות – למד עוד כאן
כתב ויתור
המידע והפרסומים אינם מיועדים להיות, ואינם מהווים, ייעוץ או המלצה פיננסית, השקעתית, מסחרית או מכל סוג אחר המסופקת או מאושרת על ידי TradingView. קרא עוד ב־תנאי השימוש.