PROTECTED SOURCE SCRIPT
מעודכן MC RSI + Stoch (multi-level bands)
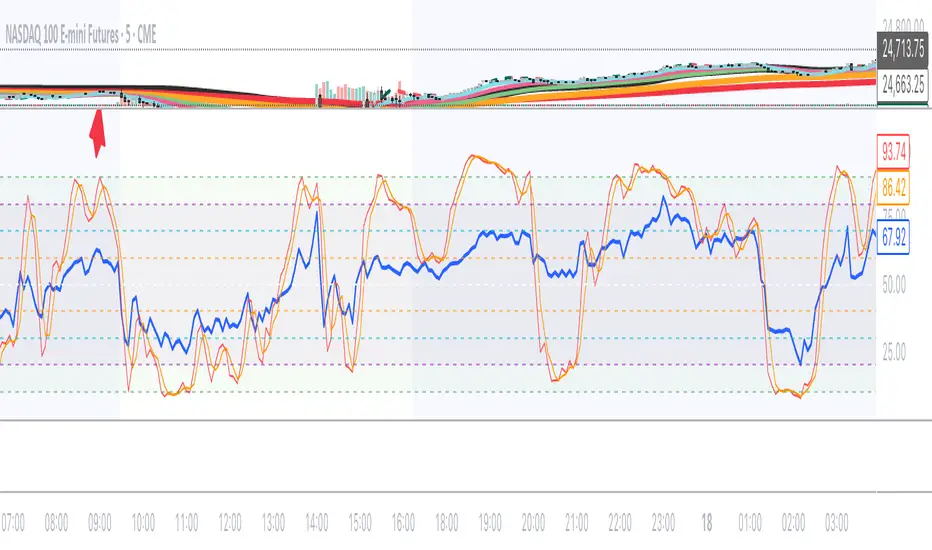
This indicator combines RSI and Stochastic Oscillator into a single panel for easier market analysis. It is designed for traders who want both momentum context and precise timing, with multiple reference levels for better decision-making.
🔧 Features
RSI (Relative Strength Index) with adjustable length (default 14).
Stochastic Oscillator (default 18, 9, 5) with smoothing applied to %K.
Both oscillators plotted in the same scale (0–100) for clear comparison.
Custom horizontal levels:
10 & 90 (purple)
20 & 80 (teal)
30 & 70 (blue)
40 & 60 (gray)
50 midline (red) for balance point reference.
Optional shaded band between 20–80 for quick visualization of momentum extremes.
Toggle switches to show/hide RSI or Stochastic independently.
🎯 How to Use
RSI gives the overall momentum strength.
Stochastic provides faster entry/exit signals by showing short-term momentum shifts.
Use the multi-level bands to identify different market conditions:
10/90 = Extreme exhaustion zones.
20/80 = Overbought/oversold boundaries.
30/70 = Secondary confirmation levels.
40/60 = Neutral momentum bands.
50 = Midline equilibrium.
הערות שחרור
This indicator combines RSI and Stochastic Oscillator into a single panel for easier market analysis. It is designed for traders who want both momentum context and precise timing, with multiple reference levels for better decision-making.🔧 Features
RSI (Relative Strength Index) with adjustable length (default 14).
Stochastic Oscillator (default 18, 9, 5) with smoothing applied to %K.
Both oscillators plotted in the same scale (0–100) for clear comparison.
Custom horizontal levels:
10 & 90 (purple)
20 & 80 (teal)
30 & 70 (blue)
40 & 60 (gray)
50 midline (red) for balance point reference.
Optional shaded band between 20–80 for quick visualization of momentum extremes.
Toggle switches to show/hide RSI or Stochastic independently.
סקריפט מוגן
סקריפט זה פורסם כמקור סגור. עם זאת, תוכל להשתמש בו בחופשיות וללא כל מגבלות – למד עוד כאן
כתב ויתור
המידע והפרסומים אינם מיועדים להיות, ואינם מהווים, ייעוץ או המלצה פיננסית, השקעתית, מסחרית או מכל סוג אחר המסופקת או מאושרת על ידי TradingView. קרא עוד ב־תנאי השימוש.
סקריפט מוגן
סקריפט זה פורסם כמקור סגור. עם זאת, תוכל להשתמש בו בחופשיות וללא כל מגבלות – למד עוד כאן
כתב ויתור
המידע והפרסומים אינם מיועדים להיות, ואינם מהווים, ייעוץ או המלצה פיננסית, השקעתית, מסחרית או מכל סוג אחר המסופקת או מאושרת על ידי TradingView. קרא עוד ב־תנאי השימוש.