OPEN-SOURCE SCRIPT
מעודכן Daily Weekly Monthly Yearly Opens Labelled - >30min Timeframes
█ OVERVIEW
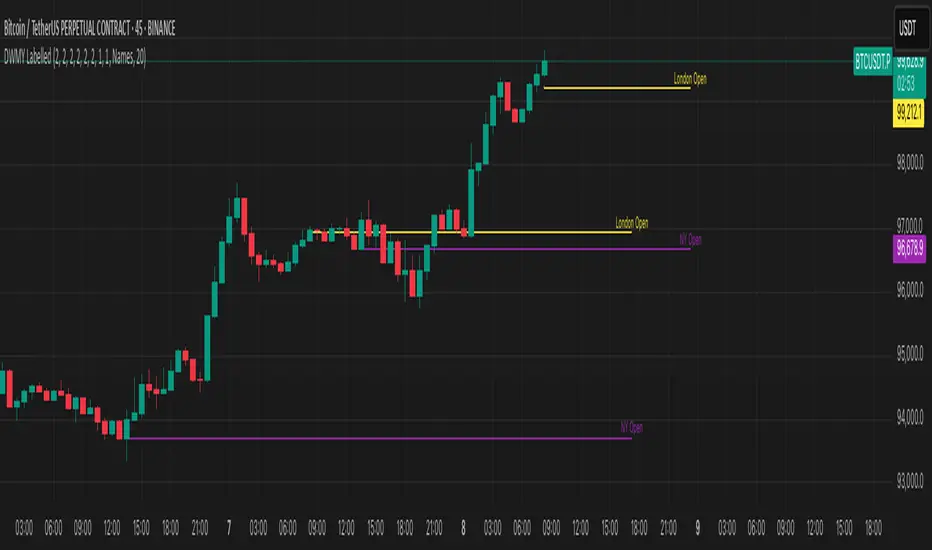
The "Daily Weekly Monthly Yearly Opens" indicator plots the opening prices for daily, weekly, monthly, and yearly timeframes on your chart. This visual aid helps traders quickly identify critical levels across multiple timeframes, providing a comprehensive view of market dynamics.
█ FEATURES
• Daily Opens: Plots the opening prices of daily candles. The color, visibility, and lookback period are customizable.
• Weekly Opens: Displays the opening prices of weekly candles. Users can adjust the color, visibility, and lookback period.
• Monthly Opens: Shows the opening prices of monthly candles with options for color, visibility, and lookback period.
• Yearly Opens: Marks the opening prices of yearly candles. Customizable features include color, visibility, and lookback period.
• Date Display Format: Allows selection between three date formats: "Names" (e.g., "Monday", "January"), "MM/DD/YY", and "DD/MM/YY".
• Show Tails: Option to extend the last opening prices to the left of historical bars.
• Discover Prices: Enables discovering the opening prices from intraday charts, useful when there are discrepancies between intraday and higher timeframes.
• Extended Hours: Option to discover the opening prices from extended trading hours if available.
• Offset: Adjust the offset for extending lines to the right of the chart.
• Highlight Most Recent Opens: Highlights the most recent opening prices for better visibility.
█ HOW TO USE
1. Add the indicator to your chart.
2. Customize the settings according to your preference:
- Enable or disable daily, weekly, monthly, and yearly opens.
- Set the colors for each timeframe's lines.
- Adjust the lookback period to control how many past opens are displayed.
- Choose the date display format to show names, MM/DD/YY, or DD/MM/YY.
- Enable tails to extend the lines of the last opening prices to the left.
- Use the discover prices option for intraday discrepancies.
- Enable extended hours if needed.
- Adjust the offset to extend lines further to the right.
- Highlight the most recent opening prices for better visual distinction.
3. Observe the lines and labels on the chart, which provide critical open levels for different timeframes, aiding in making informed trading decisions.
█ NOTES
This indicator is particularly useful for identifying support and resistance levels based on the opening prices of different timeframes. By having a clear view of these levels, traders can better plan their entries and exits, anticipate market movements, and manage risk more effectively.
█ THANKS
Special thanks to the original creator, sbtnc, for their foundational work. This version includes enhancements and additional features provided by GreatestUsername.
הערות שחרור
Allowed customized size of labels and linesהערות שחרור
Updated settings layout and max value for line thicknessהערות שחרור
Added New York and London market opens for the hourהערות שחרור
Corrected NY Open time to 13:30Added calculations for different timeframes
הערות שחרור
- NY Open only shows on timeframes 30 minutes or lessהערות שחרור
- Fixed daily time calculationהערות שחרור
- Show NY Open on higher timeframes than 30 minutesהערות שחרור
- Changed NY Open to daily and below. (Weekly didn't make sense)הערות שחרור
- Fixed bar index out of range errorהערות שחרור
Added daylight savings time for London and NY Opensהערות שחרור
Updated London Open time during daylight savings to 700 UTCסקריפט קוד פתוח
ברוח האמיתית של TradingView, יוצר הסקריפט הזה הפך אותו לקוד פתוח, כך שסוחרים יוכלו לעיין בו ולאמת את פעולתו. כל הכבוד למחבר! אמנם ניתן להשתמש בו בחינם, אך זכור כי פרסום חוזר של הקוד כפוף ל־כללי הבית שלנו.
כתב ויתור
המידע והפרסומים אינם מיועדים להיות, ואינם מהווים, ייעוץ או המלצה פיננסית, השקעתית, מסחרית או מכל סוג אחר המסופקת או מאושרת על ידי TradingView. קרא עוד ב־תנאי השימוש.
סקריפט קוד פתוח
ברוח האמיתית של TradingView, יוצר הסקריפט הזה הפך אותו לקוד פתוח, כך שסוחרים יוכלו לעיין בו ולאמת את פעולתו. כל הכבוד למחבר! אמנם ניתן להשתמש בו בחינם, אך זכור כי פרסום חוזר של הקוד כפוף ל־כללי הבית שלנו.
כתב ויתור
המידע והפרסומים אינם מיועדים להיות, ואינם מהווים, ייעוץ או המלצה פיננסית, השקעתית, מסחרית או מכל סוג אחר המסופקת או מאושרת על ידי TradingView. קרא עוד ב־תנאי השימוש.