PROTECTED SOURCE SCRIPT
מעודכן PVA Volume - DataCrypto Analytics
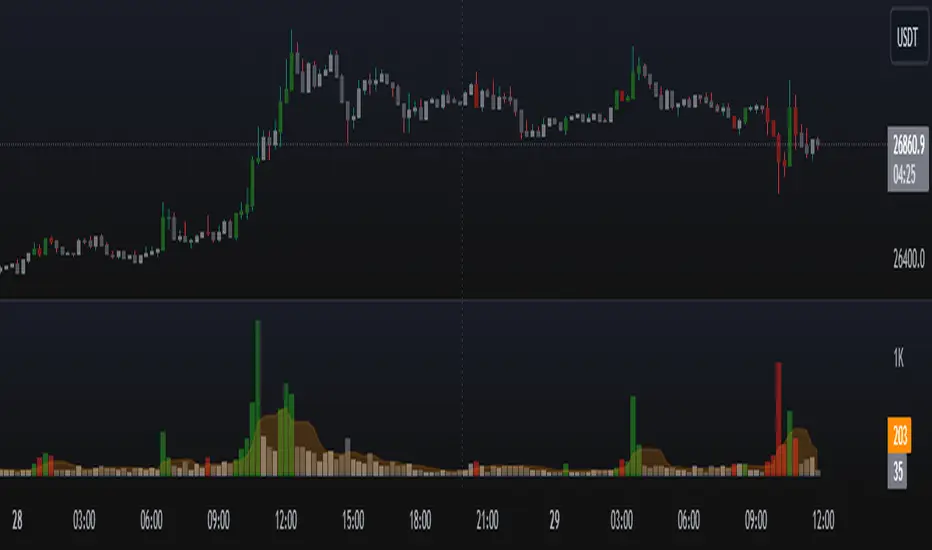
The PVA Volume indicator (Price Volume Analysis) is a technical indicator that transforms the accumulated historical data.
The PVA Volume Indicator displays a color-coded volume histogram based on Price Volume Analysis (PVA). It is plotted on a separate panel below the price chart of the underlying asset and colors the candles according to the PVA. The indicator represents four market states by means of four different colored histogram bars:
Green : Extreme volume on a bullish candle
Red : Extreme volume on a bearish candle
Silver : Neutral Volume, increasing more than the average
Gray : Neutral Volume
The PVA Volume indicator can be applied to confirm the action of the high or low price of any financial instrument.
הערות שחרור
- Update to version 5- Code organization
סקריפט מוגן
סקריפט זה פורסם כמקור סגור. עם זאת, תוכל להשתמש בו בחופשיות וללא כל מגבלות – למד עוד כאן
כתב ויתור
המידע והפרסומים אינם מיועדים להיות, ואינם מהווים, ייעוץ או המלצה פיננסית, השקעתית, מסחרית או מכל סוג אחר המסופקת או מאושרת על ידי TradingView. קרא עוד ב־תנאי השימוש.
סקריפט מוגן
סקריפט זה פורסם כמקור סגור. עם זאת, תוכל להשתמש בו בחופשיות וללא כל מגבלות – למד עוד כאן
כתב ויתור
המידע והפרסומים אינם מיועדים להיות, ואינם מהווים, ייעוץ או המלצה פיננסית, השקעתית, מסחרית או מכל סוג אחר המסופקת או מאושרת על ידי TradingView. קרא עוד ב־תנאי השימוש.