OPEN-SOURCE SCRIPT
KATIK BankNifty Upside/Downside Levels
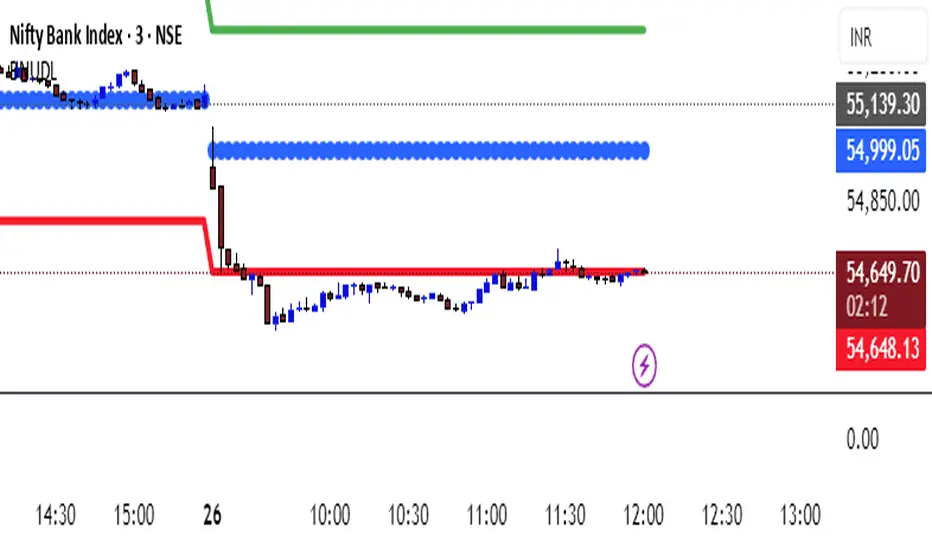
The KATIK BankNifty Upside/Downside Levels (BNUDL) indicator plots key daily reference levels for BankNifty based on its opening price. Using a predefined daily move percentage, it calculates potential upside and downside levels from the open. The script displays:
Up Level (Green): Potential bullish threshold above the open
Down Level (Red): Potential bearish threshold below the open
Open Price (Blue Circles): Daily BankNifty opening level
This tool helps traders quickly identify intraday directional bias and potential support/resistance zones around the opening price.
סקריפט קוד פתוח
ברוח האמיתית של TradingView, יוצר הסקריפט הזה הפך אותו לקוד פתוח, כך שסוחרים יוכלו לעיין בו ולאמת את פעולתו. כל הכבוד למחבר! אמנם ניתן להשתמש בו בחינם, אך זכור כי פרסום חוזר של הקוד כפוף ל־כללי הבית שלנו.
כתב ויתור
המידע והפרסומים אינם מיועדים להיות, ואינם מהווים, ייעוץ או המלצה פיננסית, השקעתית, מסחרית או מכל סוג אחר המסופקת או מאושרת על ידי TradingView. קרא עוד ב־תנאי השימוש.