OPEN-SOURCE SCRIPT
מעודכן Body Gap Detector

This script was inherited from "GAP DETECTOR" by Asch- and the modified version is being published with consent of the author.
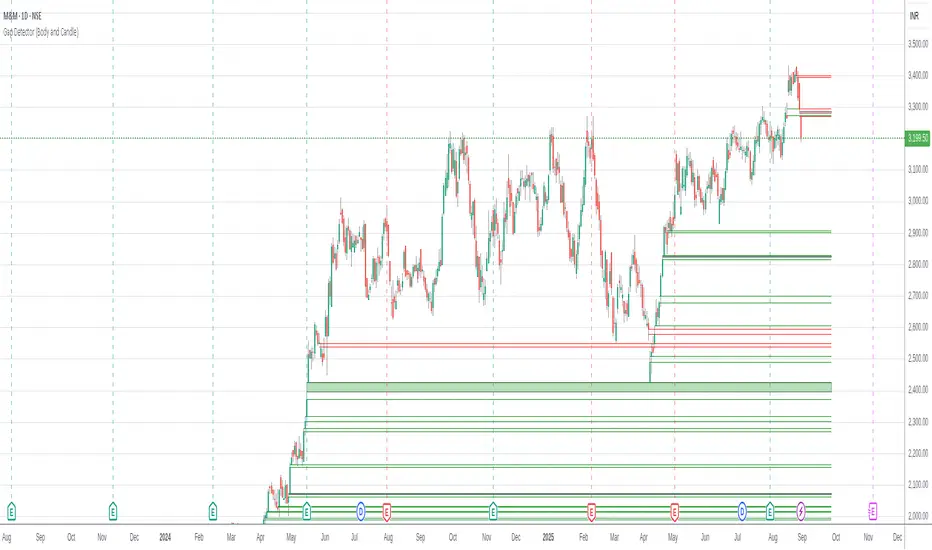
This script identifies gap up or gap down between candle bodies (for the selected time frame). The original script has been reworked to consider Open/Close instead of the High/Low. It identifies "Gap" up/down and indicates them with markers drawn from "Open/Close" of one candle to the "Close/Open" of another.
The default setting is to consider the last 1500 candles. "Gap Up" is indicated by Green bars and "Gap Down" is indicated with Red bars.
הערות שחרור
Name change.הערות שחרור
Performance update. Can traverse up to 5000 candles in history (depending on system capabilities). Resolves the "Script took more than 200ms" error for most of the charts.הערות שחרור
Performance fix to save time in loops. Can traverse up to 5000 candles in history (depending on system capabilities). Resolves the "Script took more than 200ms" error for most of the charts.הערות שחרור
Performance enhancements. Moved default candle count to 3000 (max: 5000).Note: Observed on a couple of occasions (w.r.t stock indexes), the script missed a couple of recent gaps. Please (re)validate your charts visually.
הערות שחרור
Bug fixes to accurately detect gaps. Added few more comments for clarity.הערות שחרור
Fixing chart display.הערות שחרור
Revamped design and code for performanceFinds/Detects gaps between candles and candle bodies for any chart/timeframe with O(n+delta) performance.
Candle Gaps (between wicks) act as strong support or resistance. They are drawn as solid boxes.
Body Gaps (ignores wicks) act as mild support or resistance. They are depicted with lines.
Adjust the settings for candle/body gap width, smaller the time frame, smaller the gap.
Adjust max historical bars to fine tune performance on your system/setup. The more historical bars the script scans, more time required to load the chart. At times based on system configuration, TradingView may timeout the script due to too many bars. Reducing the max bars helps in this scenario.
Happy charting !
סקריפט קוד פתוח
ברוח האמיתית של TradingView, יוצר הסקריפט הזה הפך אותו לקוד פתוח, כך שסוחרים יוכלו לעיין בו ולאמת את פעולתו. כל הכבוד למחבר! אמנם ניתן להשתמש בו בחינם, אך זכור כי פרסום חוזר של הקוד כפוף ל־כללי הבית שלנו.
כתב ויתור
המידע והפרסומים אינם מיועדים להיות, ואינם מהווים, ייעוץ או המלצה פיננסית, השקעתית, מסחרית או מכל סוג אחר המסופקת או מאושרת על ידי TradingView. קרא עוד ב־תנאי השימוש.