OPEN-SOURCE SCRIPT
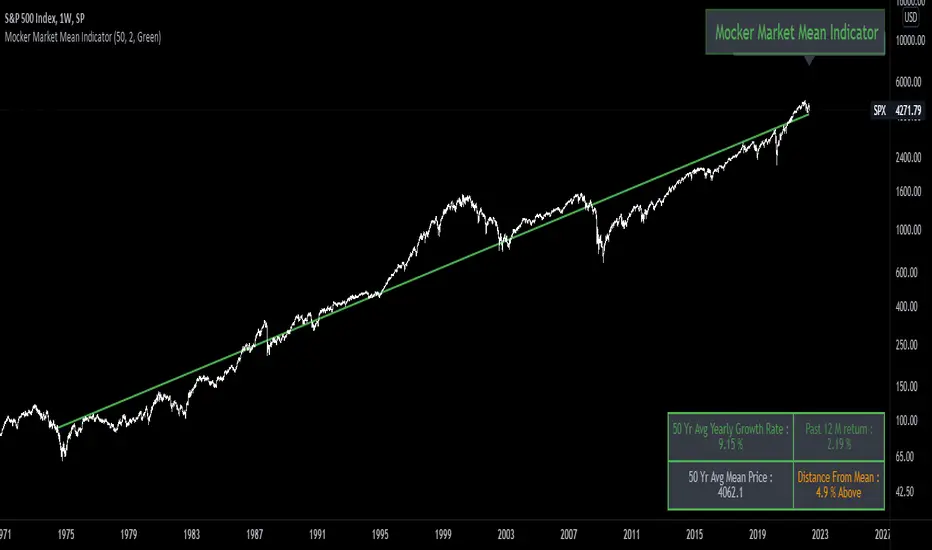
Mocker Market Mean Indicator

The objective of this indicator is to find the historical mean price of a market ( Intended for Indexes or ETF's). Based off of the concept that Benjamin Graham taught, that Mr. Market is a manic depressive forever oscillating between unjustified pessimism to extreme optimism. The intent of this indicator is to supplement a regular allocation strategy to an index or ETF , to increase that allocation when it's trading below its historical mean and decrease when trading above. It does this by using an exponential regression model to find the closest approximation of the current mean price based on past growth rate, and user defined lookback period.
סקריפט קוד פתוח
ברוח האמיתית של TradingView, יוצר הסקריפט הזה הפך אותו לקוד פתוח, כך שסוחרים יוכלו לעיין בו ולאמת את פעולתו. כל הכבוד למחבר! אמנם ניתן להשתמש בו בחינם, אך זכור כי פרסום חוזר של הקוד כפוף ל־כללי הבית שלנו.
כתב ויתור
המידע והפרסומים אינם מיועדים להיות, ואינם מהווים, ייעוץ או המלצה פיננסית, השקעתית, מסחרית או מכל סוג אחר המסופקת או מאושרת על ידי TradingView. קרא עוד ב־תנאי השימוש.