OPEN-SOURCE SCRIPT
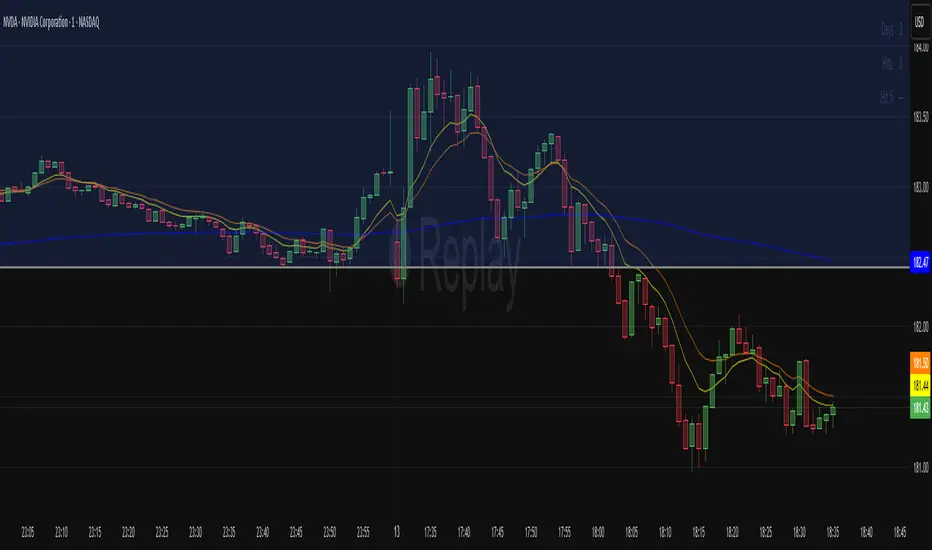
Prev-Day POC Hit Rate (v6, RTH, tolerance)

//version=6
indicator("Prev-Day POC Hit Rate (v6, RTH, tolerance)", overlay=true)
// ---- Inputs
sessionStr = input.session("0930-1600", "RTH session (exchange time)")
tolPoints = input.float(0.10, "Tolerance (points)")
tolPercent = input.float(0.10, "Tolerance (%) of prev POC")
showMarks = input.bool(true, "Show touch markers")
// ---- RTH gating in exchange TZ
sessFlag = time(timeframe.period, sessionStr)
inRTH = not na(sessFlag)
rthOpen = inRTH and not inRTH[1]
rthClose = (not inRTH) and inRTH[1]
// ---- Prior-day POC proxy = price of highest-volume 1m bar of prior RTH
var float prevPOC = na
var float curPOC = na
var float curMaxVol = 0.0
// ---- Daily hit stats
var bool hitToday = false
var int days = 0
var int hits = 0
// Finalize a day at RTH close (count touch to prevPOC)
if rthClose and not na(prevPOC)
days += 1
if hitToday
hits += 1
// Roll today's POC to prevPOC at next RTH open; reset builders/flags
if rthOpen
prevPOC := curPOC
curPOC := na
curMaxVol := 0.0
hitToday := false
// Build today's proxy POC during RTH (highest-volume 1m bar)
if inRTH
if volume > curMaxVol
curMaxVol := volume
curPOC := close // swap to (high+low+close)/3 if you prefer HLC3
// ---- Touch test against prevPOC (band = max(points, % of prevPOC))
bandPts = na(prevPOC) ? na : math.max(tolPoints, prevPOC * tolPercent * 0.01)
touched = inRTH and not na(prevPOC) and high >= (prevPOC - bandPts) and low <= (prevPOC + bandPts)
if touched
hitToday := true
// ---- Plots
plot(prevPOC, "Prev RTH POC (proxy)", color=color.new(color.fuchsia, 0), linewidth=2, style=plot.style_linebr)
bgcolor(hitToday and inRTH ? color.new(color.green, 92) : na)
plotshape(showMarks and touched ? prevPOC : na, title="Touch prev POC",
style=shape.circle, location=location.absolute, size=size.tiny, color=color.new(color.aqua, 0))
// ---- On-chart stats
hitPct = days > 0 ? (hits * 100.0 / days) : na
var table T = table.new(position.top_right, 2, 3, border_width=1)
if barstate.islastconfirmedhistory
table.cell(T, 0, 0, "Days")
table.cell(T, 1, 0, str.tostring(days))
table.cell(T, 0, 1, "Hits")
table.cell(T, 1, 1, str.tostring(hits))
table.cell(T, 0, 2, "Hit %")
table.cell(T, 1, 2, na(hitPct) ? "—" : str.tostring(hitPct, "#.0") + "%")
סקריפט קוד פתוח
ברוח TradingView אמיתית, היוצר של הסקריפט הזה הפך אותו לקוד פתוח, כך שסוחרים יכולים לבדוק ולאמת את הפונקציונליות שלו. כל הכבוד למחבר! למרות שאתה יכול להשתמש בו בחינם, זכור שפרסום מחדש של הקוד כפוף לכללי הבית שלנו.
כתב ויתור
המידע והפרסומים אינם אמורים להיות, ואינם מהווים, עצות פיננסיות, השקעות, מסחר או סוגים אחרים של עצות או המלצות שסופקו או מאושרים על ידי TradingView. קרא עוד בתנאים וההגבלות.