OPEN-SOURCE SCRIPT
Fundamentals Panel
Fundamentals Panel Description
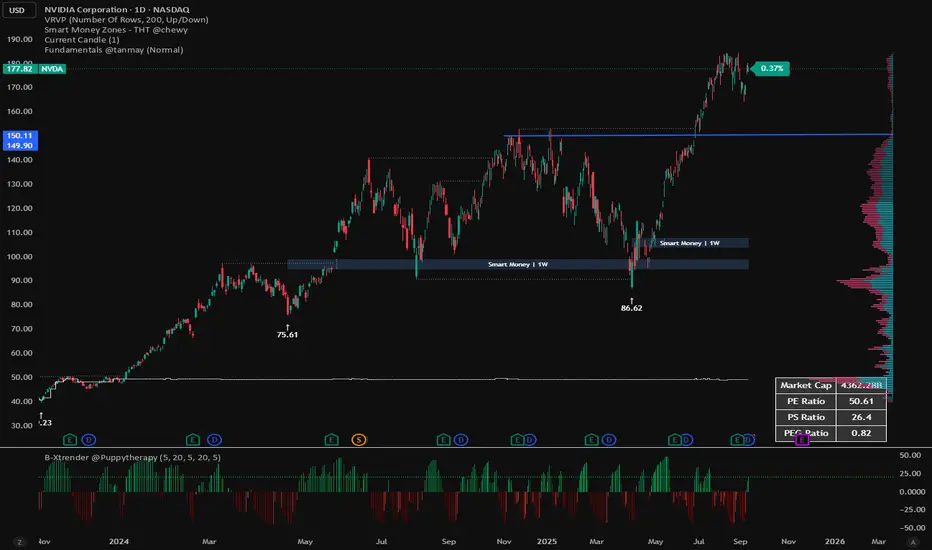
The Fundamentals Panel is a versatile Pine Script indicator that displays key financial metrics—Market Cap, P/E Ratio, P/S Ratio, and PEG Ratio—in a clean, customizable table on your TradingView chart. Designed for investors and traders, this tool brings essential company fundamentals directly to your chart, saving time and enhancing decision-making.
Quick Insights: View critical valuation metrics (Market Cap, P/E, P/S, PEG) at a glance without leaving your chart, ideal for fundamental analysis or screening stocks.
Customizable Display: Toggle each metric on or off via input settings to focus on what matters most to your strategy.
Adjustable Font Size: Choose from Small, Normal, or Large text sizes to ensure readability suits your chart setup and screen preferences.
Reliable Data: Pulls data directly from TradingView’s financial database, using diluted shares and trailing metrics for accuracy across most stocks.
Debugging Support: Includes hidden plots (visible in the Data Window) to verify raw data like shares outstanding, revenue, and PEG, helping you trust the numbers.
How It Works
The indicator fetches:
Market Cap: Calculated using diluted shares outstanding and current price.
P/E Ratio: Price divided by trailing twelve-month (TTM) diluted EPS.
P/S Ratio: Market cap divided by TTM total revenue.
PEG Ratio: Trailing PEG from TradingView’s data, with an additional calculated PEG for cross-checking.
סקריפט קוד פתוח
ברוח האמיתית של TradingView, יוצר הסקריפט הזה הפך אותו לקוד פתוח, כך שסוחרים יוכלו לעיין בו ולאמת את פעולתו. כל הכבוד למחבר! אמנם ניתן להשתמש בו בחינם, אך זכור כי פרסום חוזר של הקוד כפוף ל־כללי הבית שלנו.
כתב ויתור
המידע והפרסומים אינם מיועדים להיות, ואינם מהווים, ייעוץ או המלצה פיננסית, השקעתית, מסחרית או מכל סוג אחר המסופקת או מאושרת על ידי TradingView. קרא עוד ב־תנאי השימוש.