OPEN-SOURCE SCRIPT
CM_Laguerre PPO PercentileRank - Markets Topping
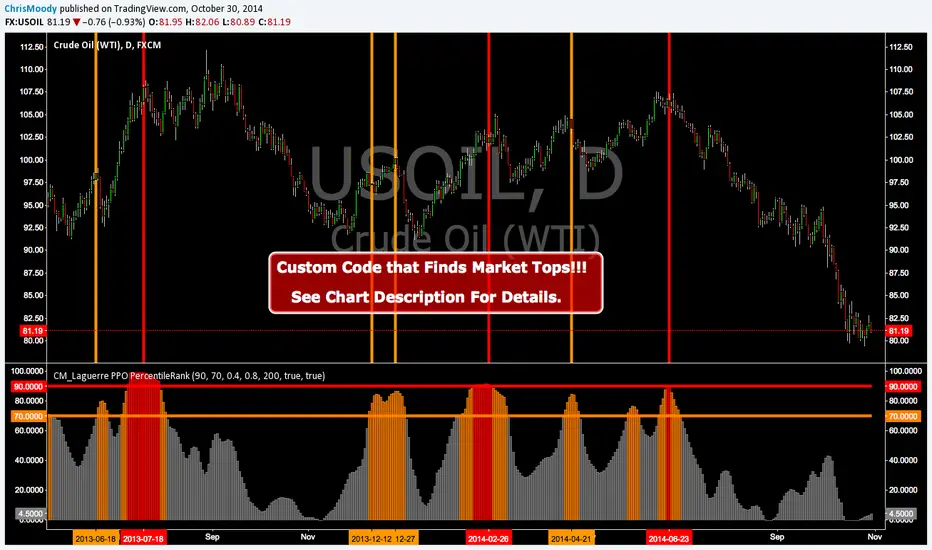
Custom Code that Finds Market Tops!!!
CM_Laguerre PPO PercentileRank - Markets Topping
Original Laguerre PPO code was Created by TheLark.
I found if I applied a Percent Rank of the PPO to view Extreme Moves in the PPO it was great at showing Market Tops.
Features via Inputs Tab:
Ability to set all PPO Indicator Values.
Ability to set Warning Threshold Line Value and Extreme Percentile Threshold Line Values.
Ability to turn On/Off Warning and Extreme Percentile Rank Lines.
***I’ve found this Indicator to be Valid…However, I have NOT Extensively tested the Settings. Initially setting the LookBack Period to 200 on A Daily chart with a 90 Extreme Percentile Rank Value works Good. Some charts changing the Lookback period to 50 an draisisng the Extreme Percentile Rank Line to 95 Works Great.
***To Be Blunt…When I look at the underlying Indicator…I don’t know why this Shows Us What It Does When the Percentile Rank Function is applied to it…But For Whatever Reason…It Just Works.
***If you Find Very Useful Settings Please Post Below
Other Indicators That Show Market Bottoms Well.
CM ATR PERCENTILERANK - GREAT FOR SHOWING MARKET BOTTOMS!
tradingview.com/v/2RhmbBnD/
GREAT CONFIRMING INDICATOR FOR THE WILLIAMS VIX FIX
tradingview.com/v/bxaCH5Hx/
TWO TRADING SYSTEMS - BASED ON EXTREME MOVES!!!
tradingview.com/v/JsSRmpBa/
סקריפט קוד פתוח
ברוח האמיתית של TradingView, יוצר הסקריפט הזה הפך אותו לקוד פתוח, כך שסוחרים יוכלו לעיין בו ולאמת את פעולתו. כל הכבוד למחבר! אמנם ניתן להשתמש בו בחינם, אך זכור כי פרסום חוזר של הקוד כפוף ל־כללי הבית שלנו.
Coming Soon: ChrisMoodyTrading.com
כתב ויתור
המידע והפרסומים אינם מיועדים להיות, ואינם מהווים, ייעוץ או המלצה פיננסית, השקעתית, מסחרית או מכל סוג אחר המסופקת או מאושרת על ידי TradingView. קרא עוד ב־תנאי השימוש.